The Game Is Afoot . . . Solr Shenanigans for Sitecore (Part 2)

Following on from Part 1 where I introduced what I’m up to here, let me jump right in to the other 5 Shenanigans for Solr + Sitecore:

Case 4 – The case of the default query crippler

  • In this scenario, a customer’s Solr was straining to the breaking point and we tracked it down to a set of circumstances where Sitecore was using a default value for ContentSearch.SearchMaxResults (defaults to “” which is int.MaxValue which is 2,147,483,647) and flooding Solr with essentially unbounded queries. That default is downright dangerous. The query logs showed the queries using a rows value of int.MaxValue in rapid succession:
  • INFO Solr Query – ?q=associated_docs:(“\*A6C71A21-47B5-156E-FBD1-B0E5EFED4D33\*”)&rows=2147483647&fq=_indexname:(domain_index_web)
    INFO Solr Query – ?q=((_fullpath:(\/sitecore/content/Branches/XYZ/*) AND _templates:(d0321826b8cd4f57ac05816471ba3ebc)))&rows=2147483647&fq=_indexname:(domain_index_web)
  • Solr will set aside some memory for the 2,147,483,647 results even if the dataset isn’t that large. I discussed a scenario like this in detail in this earlier post from 2018
  • This write-up on Solr and “Large Number of Rows” speaks exactly to this scenario: https://risdenk.github.io/2018/10/21/apache-solr-out-of-memory-symptoms-and-solutions.html

Case 5 – The case of the bandwidth blowout

  • Network bandwidth usage was off the charts for the customer we considered in this scenario. It took some digging, but we discovered it was due to a 23 GB Solr core being replicated across data centers. If one viewed the replication panel in the Solr UI, one could see the slow creep of the replication progress bar and it would never reach 100% complete before starting over.

shen5

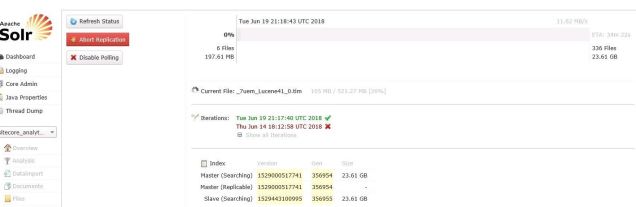
    • There was additional supporting material such as Solr WARN messages etc:

shen6

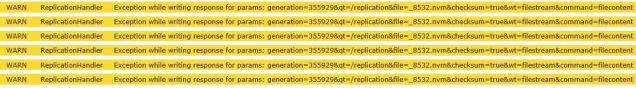
    • The network latency was too much for Solr master/slave replication to complete it’s work, but Solr kept on trying to move that 23 GB Solr core across the planet . . . and since this was the sitecore_analytics_index it was kept very busy by Sitecore. It all made for a feedback loop of frequent updates to the analytics index that couldn’t properly synchronize between data centers.
    • For this particular scenario, we determined that there wasn’t a need to replicate the sitecore_analytics_index (it was consumed only by the CM environment which didn’t require the geographical scaling through Solr replication). We disabled the master/slave replication for that specific Solr core and the tidal wave of network traffic stopped. Case closed!

Case 6 – The case of the misguided, well-intentioned, administrator

  • This scenario introduces a server administrator into the equation, and they actually cause more harm than good. The “optimize now” button in the Solr UI lured this administrator into clicking it without understanding the consequences:

OptimizeNow.JPG

  • I posted about this in detail last year, so I won’t dig too far into it here, but the gist of this scenario illustrates how Solr internally organizes files and that there are questionable UI choices for that Optimize Now button. It makes it look like an easy way for one to improve Solr performance when — in reality — clicking that Optimize Now can be pretty expensive in terms of perf, especially for a volatile Solr core.

Case 7 – The case of the AppPool recycle-fest

  • This scenario is one from a couple years ago, but it’s still relevant as a cautionary tale. For a long time, if Sitecore lost an active connection to Solr, the only option was to recycle the Sitecore AppPool. For a Solr server restart, or service restart, or even a transient network failure . . . Sitecore would need to run through the application initialization logic to reacquire Solr connectivity. In this specific case, there was a recurring network issue that interfered with Sitecore’s connectivity to Solr, so the customer scheduled IIS AppPool recycles every 15 minutes to ensure a fresh connection to Solr was available. This AppPool recycle-fest has terrible consequences for website performance as the site is constantly spending time on recycles and the related pipeline of events.
  • This case highlights why there are now more elegant ways of handling this; I recently blogged about the IsSolrAliveAgent designed to solve this exact problem. There’s periodic logic to reconnect Sitecore with Solr now, and it’s important to appreciate why it’s there and — probably — why you may want to tune the default setting of every 10 minutes for your production environment.

That’s the 7 Shenanigans related to Sitecore and Solr from my talk earlier in October. It’s a fun paradigm for learning more about the overlaps of Sitecore and Solr and I hope it helps others to get more from their Sitecore + Solr technology stack!

Sitecore’s SessionDictionaryData class saves the day

More and more projects are using Azure SQL as the database back-end for Sitecore (so long as they’re running Sitecore 8.2 and newer — if alignment to Sitecore official support guidance is important to you). This sets up a new class of performance considerations around Azure SQL, and I want to share one tuning option we learned while investigating high DTU usage for the Sitecore xDB “ReferenceData” database in a Sitecore 9 PaaS build. We wanted to off-load some of the work this “ReferenceData” database was doing, and investigations into which Azure SQL queries were causing the DTU spikes pointed to INNER JOINs between the ReferenceData.DefinitionMonikers and ReferenceData.Definitions tables.

Sitecore support pointed us in the right direction at this juncture, since the default DictionaryData was using AzureSQL for persistence — we should consider a store more suited to rapid key/value access. If this sounds like a job for Redis, you’d be correct, and fortunately Sitecore has an implementation that’s suited for this type of dictionary access in the Sitecore.Analytics.Data.Dictionaries.DictionaryData.Session.SessionDictionaryData class.

The standard Sitecore pipeline we’re talking about is the getDictionaryDataStorage pipeline and it’s used by Sitecore Analytics to store Device, UserAgent, and other key/value pair lookups. Here’s it’s definition:

The alternative we moved to is to use session state for storing that rapidly requested data,  so we updated the DictionaryData node to instead use the class Sitecore.Analytics.Data.Dictionaries.DictionaryData.Session.SessionDictionaryData. For this Azure PaaS solution, it amounts to using Azure Redis for this work since that’s where the session state is managed. Here’s the new definition:

What this boils down to is the implementation in Sitecore.Analytics.DataAccess.dll of Sitecore.Analytics.DataAccess.Dictionaries.DataStorage.ReferenceDataClientDictionary was shown to be a performance bottleneck for this particular project, so changing to use the Sitecore.Analytics.dll with it’s Sitecore.Analytics.Data.Dictionaries.DictionaryData.Session.SessionDictionaryData aligns the project to a better-fit persistence mechanism.

We considered if we could improve upon this progress by extending the SessionDictionaryData class to be IIS in-memory regardless of the Sitecore session-state configuration; there would be no machine boundary to cross to resolve the (apparently) volatile data. Site visitors would require affinity to a specific AppService host in Azure, though, with this and it’s possible – or even likely — that Sitecore assumes this is shared state across an entire implementation. We talked ourselves out of seriously considering a pure IIS in-memory solution.

I think it’s possible we could improve the performance with the default ReferenceDataClientDictionary by tuning any caches around this analytics data, but I didn’t look into that since time was of the essence for this investigation and the SessionDictionaryData class looked like such a quick win. I may revisit that in the next iteration, however, depending on how this new solution performs over the long term.

Curious case of the LocationsDictionaryCache

We have some cache monitoring in place for some enterprise Sitecore customers and that system has found one particular cache being evicted roughly 40 times per hour for one particular customer. It’s curious, as this cache isn’t covered in the standard documentation for Sitecore’s caches. Sitecore support had to point me in the right direction on this . . . and it’s an interesting case.

The LocationsDictionaryCache cache is defined in Sitecore.Analytics.Data.Dictionaries.LocationsDictionary and there’s a hard coded 600 second expiration in that object definition:

Expires

There’s also a maxCacheSize set of 0xf4240 hex (1,000,000 or 976 KB). You can’t alter these settings through configuration, you’d have to compile a new DLL to alter these values.

It’s not clear to me that the quick eviction/turn-over of this cache is a perf issue to worry about . . . I think, at this point, it’s working as expected and indicative of a busy site with lots of Sitecore Analytics and Tracking behaviour. Reviewing the decompiled Sitecore code that uses this class (like in Sitecore.Analytics.Tracking.CurrentVisitContext or Sitecore.Analytics.Pipelines.CommitSession.ProcessSubscriptions), it appears that this cache serves as a short-term lookup along the same lines as devices, user-agents, etc. Why this particular cache is active in ways UserAgentDictionaryCache and others is not, besides the obvious 600 second life span, is something we need to dig further into — but I don’t know that it’s a perf bottleneck for our given scenario.


xDB Reporting Database Rebuild Help

I’ve created something like this every time I need to rebuild the Sitecore “reporting” database (this link covers the basic process), this time I’m posting it online so I can re-use it next time around!

This is the script for generating the T-SQL that’s required to complete step #3 in the write-up when you’re following the “Rebuild Reporting Database” instructions:

“In the Rebuild Reporting Database page, when you see Waiting to receive to data status, copy the following marketing definition tables from the primary to the secondary reporting database”

I have written the SQL several times to do this, but this time I took a run at DRY (don’t repeat yourself) to script this SQL out.  Alas, I think my T-SQL comes in at 40+ lines of code versus the raw SQL to run which is just 35 lines and much easier to read, in my opinion.

Either way, you can pick which you prefer as I’ll share them both here

First, the plain vanilla SQL commands for copying those database tables:

INSERT INTO target_Analytics.dbo.CampaignActivityDefinitions
         SELECT source_Analytics.dbo.CampaignActivityDefinitions.*
         FROM  source_Analytics.dbo.CampaignActivityDefinitions ;

INSERT INTO target_Analytics.dbo.GoalDefinitions
         SELECT source_Analytics.dbo.GoalDefinitions.*
         FROM  source_Analytics.dbo.GoalDefinitions ;

INSERT INTO target_Analytics.dbo.OutcomeDefinitions
         SELECT source_Analytics.dbo.OutcomeDefinitions.*
         FROM  source_Analytics.dbo.OutcomeDefinitions ;

INSERT INTO target_Analytics.dbo.MarketingAssetDefinitions
         SELECT source_Analytics.dbo.MarketingAssetDefinitions.*
         FROM  source_Analytics.dbo.MarketingAssetDefinitions ;

INSERT INTO target_Analytics.dbo.Taxonomy_TaxonEntity
         SELECT source_Analytics.dbo.Taxonomy_TaxonEntity.*
         FROM  source_Analytics.dbo.Taxonomy_TaxonEntity ;

INSERT INTO target_Analytics.dbo.Taxonomy_TaxonEntityFieldDefinition
         SELECT source_Analytics.dbo.Taxonomy_TaxonEntityFieldDefinition.*
         FROM  source_Analytics.dbo.Taxonomy_TaxonEntityFieldDefinition ;

INSERT INTO target_Analytics.dbo.Taxonomy_TaxonEntityFieldValue
         SELECT source_Analytics.dbo.Taxonomy_TaxonEntityFieldValue.*
         FROM  source_Analytics.dbo.Taxonomy_TaxonEntityFieldValue ;

And now, here’s the T-SQL attempt to “simplify” the process of creating a script like the above for future projects (yet I prefer it less to the brute force approach):

The advantage to the below is you set your source and target variables to the names of the SQL Server databases, and then you’re all set.

DECLARE @source VARCHAR(100)
DECLARE @target VARCHAR(100)
SET @source = 'source_Analytics'
SET @target = 'target_Analytics'

SET NOCOUNT ON
--List approach will work in SQL Server 2012 only
DECLARE @ListOfTables TABLE(IDs VARCHAR(100));
INSERT INTO @ListOfTables
VALUES('CampaignActivityDefinitions'),
  ('GoalDefinitions'),
  ('OutcomeDefinitions'),
  ('MarketingAssetDefinitions'),
  ('Taxonomy_TaxonEntity'),
  ('Taxonomy_TaxonEntityFieldDefinition'),
  ('Taxonomy_TaxonEntityFieldValue');

SET ROWCOUNT 0
SELECTX NULL mykey, * INTO #mytemp FROM @ListOfTables
DECLARE @theTable varchar(100)
DECLARE @sql varchar(1000)

SET ROWCOUNT 1
UPDATE #mytemp SET mykey = 1

WHILE @@rowcount > 0
BEGIN
    SET ROWCOUNT 0
    SELECT @theTable = (SELECT IDs FROM #mytemp WHERE mykey = 1)
    PRINT 'INSERT INTO ' + @target + '.dbo.' + @theTable + '
         SELECT ' + @source +  '.dbo.' + @theTable + '.*
         FROM  ' + @source + '.dbo.' + @theTable + ' ;'
     --use 'EXEC to run the dynamic SQL, instead of PRINT, 
     --if you're feeling brave

    DELETE #mytemp WHERE mykey = 1
    SET ROWCOUNT 1
    UPDATE #mytemp SET mykey = 1
END
SET ROWCOUNT 0
DROP TABLE #mytemp


Azure AppGateways and Sitecore’s Use of X-Forwarded-For

I’m writing this up so I have a convenient reference for future projects — it looks like there’s a bug with Sitecore’s Analytics library and how it handles IP addresses through an Azure Application Gateway.

Sitecore relies on the X-Forwarded-For HTTP header when a load balancer sits between the Sitecore IIS server and the client browser.  I rarely encounter Sitecore implementations without load balancers, they’re critical for performance, security, resiliency during upgrades, etc.  During some Sitecore testing behind the App Gateway, we observed the following message in the Sitecore logs:

Cannot parse a valid IP address from X-Forwarded-For header

About this time, a friend of mine — and another smart Sitecore guy “Bryan Furlong” — commented to me how his current project ran into port numbers in their IP addresses for xDB purposes . . . so we committed to investigating.

Using Reflector, I confirmed this specific “Cannot parse a valid IP address from” exception message appears in the Process method in the Sitecore.Analytics.Pipelines.CreateVisits.XForwardedFor class:

try
{
    address = IPAddress.Parse(ipFromHeader);
}
catch (FormatException)
{
    Log.Warn($"Cannot parse a valid IP address from {forwardedRequestHttpHeader} header.", this);
    return;
}

It looked like the Azure App Gateway, a specific variety of load balancer for Azure implementations, includes port numbers with the IP address when relaying traffic.  This port number is not handled well by the Sitecore.Analytics processing code, and — in this particular case — led to the failure of GeoIP resolution for an Azure Sitecore implementation.

To verify what was going on, I added the X-Forwarded-For field as a custom field to the IIS Logs and compared the contents.

xfor

Behind the Azure App Gateway, “X-Forwarded-For” fields in the IIS Logs show data such as:

  • 50.14.232.1:45712
  • 74.14.167.1:28336

By comparison, behind the other types of load balancers I looked at, the IIS Logs show data such as:

  • 46.246.335.99
  • 92.77.214.84

Looks like confirmation of the issue!

One cool aspect of working at Rackspace is access to lots of smart people across the industry, and we verified with the App Gateway team at Microsoft that X-Forwarded-For is a comma separated list of <I{:Port> and changing the presence of the port number is NOT currently configurable.  We would need our Sitecore implementation to strip off the port portion.

The Sitecore customization to address this is fairly straight-forward.  Instead of the default CreateVisit pipeline defined as follows in Sitecore.Analytics.Tracking.config . . .

      <createVisit>
        ...
        <processor type="Sitecore.Analytics.Pipelines.CreateVisits.XForwardedFor, Sitecore.Analytics">
          <HeaderIpIndex>0</HeaderIpIndex>
        </processor>
        ...
      </createVisit>

. . . one must introduce their own library and override the GetIpFromHeader method to account for a port number:

public class XForwardedFor : Sitecore.Analytics.Pipelines.CreateVisits.XForwardedFor
    {
        protected override string GetIpFromHeader(string theHeader)
        {
            string[] source = theHeader.Split(new char[] { ',' });
            int headerIpIndex = base.HeaderIpIndex;
            string str = (headerIpIndex < source.Length) ? source[headerIpIndex] : source.LastOrDefault<string>();
            if (string.IsNullOrEmpty(str))
            {
                return null;
            }
            string[] strArray2 = str.Split(new char[] { ':' }, StringSplitOptions.RemoveEmptyEntries);
            if (strArray2.Length > 1)
            {
                str = strArray2[0];
            }
            return str.Trim();
        }
    }

In talking through this all with Sitecore support, they confirmed it’s a product bug and tracked as 132442 issue.

To ensure our custom code replaces the default Sitecore pipeline code, the following patch include file is important:

<?xml version="1.0" encoding="utf-8" ?>
<configuration xmlns:patch="http://www.sitecore.net/xmlconfig/" xmlns:xdt="http://schemas.microsoft.com/XML-Document-Transform">
  <sitecore>
    <pipelines>
      <createVisit>
        <processor type="Our.Custom.Namespace.And.Class.XForwardedFor,Our.Custom.Assembly.dll"
              patch:instead="*[@type='Sitecore.Analytics.Pipelines.CreateVisits.XForwardedFor, Sitecore.Analytics']" />
      </createVisit>
    </pipelines>
  </sitecore>
</configuration>

Update December 10, 2018 – I learned that Sitecore shares an official patch for this issue at https://sitecore.app.box.com/s/g9g8mu7orb3qkbc7dct2i351qaarhwes, so if you want to review their Sitecore.Support.Analytics.Pipelines.CreateVisits.XForwardedFor to address this issue, check it out.

Slice & Dice Solr Indexes for Sitecore with Banana UI

I’m fresh off a week at the Lucene-Solr Revolution conference and training, and it was a real eye-opener for me!  I have many pages of notes, so many potential blog posts bridging the Solr/Sitecore divide, and saw up-close the vibrancy of the Solr community.  There’s so much innovation going on there . . . it was really inspiring.

One take away from the experience was how Solr has a variety of tools for index analysis that could be really useful for Sitecore scenarios.  I know there’s some basic Sitecore diagnostic pages that will shed light on some index internals for Lucene or Solr, and the Solr admin UI has lots of powerful features, but I wanted to share in this blog post a bit about Banana UI and what it can do for us in the Sitecore world.

What Banana UI Can Do

Before explaining how Banana UI works, it’s probably most useful to show a screen shot of it in action:

banana0

The above shows 3 custom dashboard widgets (Banana calls them panels) that are processing against my sitecore_master_index for a LaunchSitecore 8.1 demo instance I have.  I quickly contrived the above 3 visualizations, using just some sample data, but they represent a bit of the possible options using this free tool.

The first dashboard charts parsedcreatedby_s values for the LaunchSitecore site (I set it to exclude the 15,000 items authored by the Sitecore admin using a Solr filter of q=-parsedupdatedby_s:sitecoreadmin).

banana2.JPG

The second dashboard is a basic word cloud derived from title_t in the LaunchSitecore site index.  Banana UI makes it easy to inspect the underlying query for a visualization, so I could find the baseline query executed against Solr for this was q=*%3A*&wt=json&rows=0&fq=__smallcreateddate_tdt:[2011-10-17T19:49:57.000Z%20TO%202016-10-17T19:49:57.000Z]&facet=true&facet.field=title_t&facet.limit=20).

banana3.JPG

The third dashboard shows a heat map of culture_s and menu_title_t.  I wanted to show the heatmap since it’s a great way of visualizing data correlations, and in this case it illustrates how heavily LaunchSitecore relies on the en culture for item content.

banana4

The crux of the Banana UI is time series of data, although it has powerful applications for other data too.  For my example dashboards, I setup a time window spanning 5 years so it included all the origin data for LaunchSitecore (has it really been 5 years since that project got off the ground?).  Like I said above, I wanted to exclude the 15,000+ pieces of sitecore\admin content since it would dominate the chart in dashboard 1.  With Banana UI, it’s all driven through the single page application:

banana1.JPG

I’m just getting started with Banana as a tool for examining customer Solr implementations for Sitecore . . . I can envision a lot of interesting angles to this, whether using the sitecore_analytics_index for xDB visualizations or metadata analysis with canned searches of the sitecore_web_index.  There’s probably a use case for everyone: business users wanting to keep tabs on a few key terms in the corpus, super-users doing site-wide analysis, certainly for technical users curious about term frequencies or looking to test out some Solr faceting with zero coding and a nice visual interface for feedback.  Banana UI belongs on the radar of every Sitecore implementation making use of Solr.

How To Put Banana UI To Use

Quoting from the Lucidwork’s GitHub repo for Banana:

The Banana project was forked from Kibana, and works with all kinds of time series (and non-time series) data stored in Apache Solr. It uses Kibana’s powerful dashboard configuration capabilities, ports key panels to work with Solr, and provides significant additional capabilities, including new panels that leverage D3.js.

The goal is to create a rich and flexible UI, enabling users to rapidly develop end-to-end applications that leverage the power of Apache Solr.

Here’s a key reference on how to generally configure Banana for Solr.

I’m not going to repeat the reference above, but the gist of it is to copy the Banana UI source into your solr-webapp directory and customize a couple settings (like the name of the Solr collection you want to analyze), then you’re ready to begin slicing and dicing the Solr information:

banana

One can access the Banana UI  via http://your solr server:your solr port/solr/banana/ (or solr/banana/src/index.html if the redirects aren’t setup).  I found Chrome to be the best browser for visualizing the data.  You can save pre-built dashboards for ease of sharing, or build dashboards out ad-hoc.

While Banana (and the original, Kibana) is designed for viewing event and log data in real-time, it’s charting components work great as a facade in front of Solr and it deploys as a simple stand-alone directory as part of the Solr web app.  I’m looking forward to seeing how I can further shape Sitecore specific dashboards with Banana, as currently I’m really just scratching the surface.

Sitecore and TTL Index Heresy for MongoDB

Background

Part of our role at Rackspace is to be pro-active in tuning and optimizing Sitecore implementations for our customers.  Sometimes, the “optimizations” come more in terms of cost-savings instead of performance benefits, and sometimes there is a correlation.

Here’s an optimization that is more oriented to cost-savings.  We have customers using MongoDB for both private and shared session state in Sitecore, as well as xDB data collections; they’re using a hosted MongoDB service through ObjectRocket which provides provisioning elasticity, good performance, and access to really strong MongoDB pros.  We noticed old HTTP session data accumulating in the session collections for one customer, and couldn’t find an obvious explanation.  These session records shouldn’t be leaking through the MongoDB clean-up logic that’s part of the Sitecore API (Sitecore.SessionProvider.MongoDB.MongoSessionStateProvider), but we wanted to correct it and understand why.

The catch was, the customer’s development had several higher priority issues they were working on, and sifting through a root cause analysis of something like this could take some time.  In the interim, we addressed how to clean out the old session data from MongoDB — if the customer was using SQL Server for sessions state, a SQL Server agent deleting expired sessions could be easily employed . . . but that isn’t an option for MongoDB.

Research

At Rackspace, we began evaluating options for a MongoDB equivalent to the “clean up old session records” process and so I started by reviewing everything I could find about data retention for MongoDB and Sitecore.  It turns out there isn’t much.  There isn’t mention of data clean-up in the Sitecore documentation on shared and private session for MongoDB.  There isn’t an explicit <agent> configured anywhere, either.  With Reflector, I started looking through the Sitecore.SessionProvider.MongoDB.MongoSessionStateProvider class and I didn’t see any logic related to data clean-up.

I did finally find some success, however, in reviewing the Sitecore.SessionProvider.MongoDB.MongoSessionStateProvider class that extends the abstract Sitecore.SessionProvider.SitecoreSessionStateStoreProvider class.

The abstract class uses a timer (controlled by the pollingInterval set for the provider); it runs OnProcessExpiredItems . . . and then GetExpiredItemExclusive . . . and eventually RemoveItem for that record.  That finally calls through to the MongoDB API with the delete query:

RemoveItemThis was all helpful information to the broader team working to determine why the records were remaining in MongoDB, but we needed a quick non-invasive solution.

TTL Indexes

MongoDB supports “Time to Live (TTL) Indexes” which purge data based on time rules.  Data older than 1 week, for example, could automatically be removed with this index type.  That’s surely acceptable for sessions state records that leak through the Sitecore API.  We coordinated with the ObjectRocket team and are setting the customer up with TTL Indexes instead of the default; this should dramatically reduce the data storage footprint.

Heresy

While pursuing this effort on behalf of session state management, I realized this could be an intriguing solution to data retention challenges with Sitecore’s xDB.  Using MongoDB TTL indexes for the xDB collections would prevent that data from growing out of control.  Set a TTL value of 180 days, for example, and make use of just the most recent 6 months of user activity as part of content personalization, profiling, etc.  Of course, one sacrifices the value of the old data if one expires it after a set time.  Remember, I’m acknowledging this is heresy! 🙂

I really wonder, though, how many Sitecore implementations intend to store all the xDB data indefinitely and have a strategy for making use of all that old, ever-accumulating, data?  I think the promise of xDB analytics-based presentation rules is far greater than the reality.  I see many organizations lacking a cohesive plan for what data to gather into xDB, and how to effectively make use of it.

I think TTL Indexes for MongoDB would be a good safety net for those companies still sorting out their path with xDB and analytics, without having to bank massive volumes of data in MongoDB during the maturation process.

One final note: since conserving disk space is a priority, performing a weekly data compaction for MongoDB is a good idea.  This fully reclaims the space for all the expired documents.

Sitecore Live Session Agents

It can be fun when an hour-long meeting is cancelled at the last minute; you suddenly have a chance to tackle your personal “back log” right?

This note on xDB processing is part of my “back log” so without further ado . . . let me begin by noting how Sitecore is getting better at designing modular elements of functionality. They’ve been at it for years.

The Menu of Sitecore Server Roles

The notion of a “Sitecore server” being a single defined resource is a thing of the past.   Things used to be either Content Management (CM) or Content Delivery (CD); now, CM or CD servers can be supplemented with dedicated publishing servers, the xDB 3 amigos (processing, aggregation, and reporting servers), search work-horses (via Solr, Coveo, or ?).  One can combine elements together so you could have processing + aggregation, or your dedicated publishing server could run Solr for search.  I’m not going to discuss the databases that support all of this, MongoDB or SQL Server, but the count of databases and collections is also ever-increasing.

Then, there are the less well-publicized “mini server roles” like the one that does GeoIP resolution work in the background.  This post is mostly about another specific “mini” Sitecore server known as the Live Session agent.

There is a clear pattern from Sitecore that “servers” are combinations of several slices of different functionality.  I think this shows a maturation in the product, and realization that different implementations will be making use of Sitecore components in different ways.  It makes for flexibility and lots of tuning opportunities.  It keeps a Sitecore Architect employed, I suppose!  I do worry about the stability of all these permutations, however, and along with this pattern is the bloat of configuration files and the potential for misconfiguration.  There are some noble efforts at improving this, though, and I think the complexity of configuration will improve in future Sitecore releases.

The Live Session “Role”

While not truly a “role” in the standard Sitecore sense, the Live Session Agent extends a Content Delivery (CD) node to also process xDB automation states.  This is to assist in monitoring and processing the queue of contacts with automation states with timeouts. One could run a dedicated server just for this Live Session Agent activity, I suppose, or employ a set of CD servers to share the load.  From the documentation:

You can enable the background agent only on a subset of instances, such as on a dedicated instance or a set of instances that only process the timeout and not HTTP requests.

In reviewing the granular tuning settings exposed by Sitecore, Live Session Agent optimization could be a bit of a dark art.  Should be some fun ahead, though, and a chance to enlist additional server resources to alleviate a potential bottleneck around engagement automation state processing.

The Live Session Agent depends on two config files (Sitecore.EngagementAutomation.LiveSessionAgent.config and Sitecore.EngagementAutomation.LiveSessionAgent.Processing.config) and a single .dll (Sitecore.EngagementAutomation.LiveSessionAgent.dll) that can be downloaded under the Resources section here.  The documentation is sufficient to get you started and, while I find it light on practical guidance, there is an obvious effort to expose all the knobs and switches one might require for this sort of background process management (threads to allocate etc).

I suspect this Live Session Agent will become a mainstay in the performance and scaling efforts for more complicated Sitecore xDB implementations — but most any xDB project could benefit from additional resources devoted to engagement automation state processing.  I think the trick is not overwhelming the CD server that you ask to pitch-in and help.

Now, with the other 30 minutes I found by that meeting being cancelled, I’m going to review what all is going on with Sitecore.EngagementAutomation.LiveSessionAgent.dll with Reflector . . .

GeoIP Resolution For Sitecore Explained

A Sitecore implementation can use MaxMind lookups for GeoIP resolution; this is valuable information for marketers as it provides for geography-based segmentation in reports and decision making in the Sitecore Analytics package.  The Analytics.PerformLookup setting in the /App_Config/Include/Sitecore.Analytics.config file governs the lookup activity, and is true with an OOTB installation config file (so be careful!).

It’s recommended to only set this setting to true for one server in an implementation; set this setting to false for the other servers.  For scaled (multi-server) Sitecore installations, this is a common issue since the default config file enables Analytics.PerformLookup.

You can enable lookups on either a CM or a CD instance.  The Sitecore instance should be able to access the MaxMind web service (via the public internet) in order to complete the work.  Having more than one server configured as true for this setting can cause SQL deadlocks and other problems, as well as duplicating your traffic to MaxMind (and using any lookups you’re paying for).

Under the covers, this is what this PerformLookup setting is doing:

  • Sitecore periodically starts a task on the server to perform GeoIP lookups if the setting Analytics.PerformLookup is true in Sitecore.Analytics.config
    1. This task is considered the “Lookup Worker” task
    2. The frequency of the Lookup Worker running is governed by the Analytics.PerformLookup.Interval setting in Sitecore.Analytics.config
    3. The Lookup Worker takes records in the Sitecore “Visit” table and processes any with an EmptyLocationID value in the LocationID column
      • the EmptyLocationId is a special GUID that is generated on each environment, check the first record in the Locations table with a blank business name, country, etc if you want to see what GUID your system is using
    4. The goal of the Lookup Worker is to process Visit records with an EmptyLocationID and populate them with data, so they are no longer empty.  It does this by communicating with MaxMind.

This is only part of the picture, though, as it explains how the background agent determines GeoIP  information for Visits.

What about when a page loads that makes decisions based on the visitor’s GeoIP information; for example, news sites might target different Sitecore content to European visitors compared with Asian visitors.

The process of resolving a visitor’s GeoIP information is as follows:

  1. Attempt to retrieve the GeoIP information from the memory cache
  2. If there’s no data from step 1, retrieve GeoIP information from the Analytics database
  3. If there’s no data from step 2, request GeoIP information from the MaxMind geolocation service

Each of the above steps gets progressively slower; reading from memory >  reading from the database > reading from a remote web service.

When it comes to step 3, if a request is made to MaxMind during a visitor’s HTTP request, Sitecore doesn’t make that a synchronous call and wait for a response.  I’ve seen many websites perform slowly due to blocking web service calls, so this is a smart design decision by Sitecore.  If, however, you’re in a situation where you want to wait for the GeoIP data, refer to this KB article from Sitecore for two methods of addressing it: https://kb.sitecore.net/articles/320734.

If you don’t want to pursue either work-around in the Sitecore KB article, but are using geolocation targeting in your implementation, you should plan for a graceful fallback.  Provide for a generic set of data for non-geolocation targeted visitors.

Additional references on GeoIP resolution with Sitecore include: