OPTIONS and PUT Verbs for the Sitecore Publishing Service

I’ve been involved with a lot of implementations of the new Sitecore Publishing Service lately and they’re starting to all run together. Before this episode fades too far into history, I want to record what I learned in case it’s useful to others (or myself!) at some point.

I’m going to skip all the preamble about .NET Core and how the new Publishing Service is designed to be lean and mean . . . that’s covered adequately in other places by now. I’ll jump right into this scenario where the Publishing Service was installed but all publishing operations would fail from the Sitecore Content Management server. It seemed like the CM wasn’t able to reach the .NET Core Publishing Service endpoint, but I confirmed the following were all in place:

  1. the host file included an entry for 127.0.0.1 pointing to Sitecore.Publishing.Service
  2. the Publishing Service was hosted through IIS with the Sitecore.Publishing.Service binding
  3. http://sitecore.publishing.service/api/publishing/operations/status responded with the expected JSON response “status 0” — so I concluded the service itself was OK

The Sitecore logs did have this cryptic “NotFound Not Found” exception, which was all I had to go on at first:

ERROR [Sitecore Services]: HTTP POST
URL http://cm.website.com/sitecore/api/ssc/publishing/jobs/0/ItemPublish

Exception System.AggregateException: One or more errors occurred. ---> Sitecore.Framework.Publishing.Client.Http.HttpServiceResponseException: The remote service encountered a problem processing the request:
NotFound Not Found
System.Net.Http.StreamContent
   at Sitecore.Framework.Publishing.Client.Http.JsonClient.<SendRequest>d__14.MoveNext()
--- End of stack trace from previous location where exception was thrown ---

I envisioned a frustrated IIS server yelling “NotFound Not Found” — and, actually, that wasn’t so far from the truth. To discover the truth, I needed Fiddler.

There’s a ton of API calls going on when Sitecore CM servers interact with the Publishing Service, so Fiddler was the way to get a handle on all that communication. Sitecore has a KB article on how to wire up Fiddler to your Sitecore implementation, which is handy, and I put it to good use.

It was also necessary to dial up the verbosity of the Publishing Service instrumentation so we can see the full picture. One does this through the \config\sitecore\sc.logging.xml file under the Publishing Service installation. Set the filters like this . . .

 <Filters>
<Sitecore>Debug</Sitecore>
<Default>Debug</Default>
</Filters>

. . . and restart the .NET Core service to make sure these take effect.

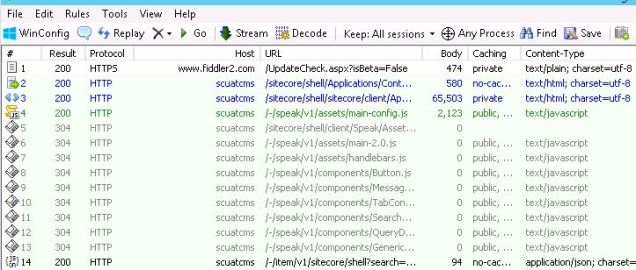
Fiddler can provide an overwhelming volume of information; imagine hundreds of entries like the following:
Fiddler1

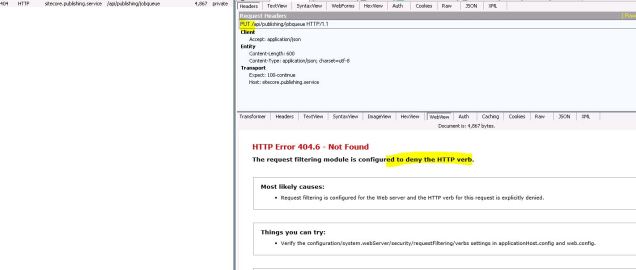
One technique is to carefully clear the Fiddler traces until just before you interact with the browser to perform your action, in my case just before I press the final Publish button in the Sitecore CM environment. I still had a lot of noisy Fiddler data to ignore, which I’ll remove from the screenshot below, but finally it revealed this red entry meaning failure.Fiddler2

And if you click on the details of that Fiddler trace you can inspect all the particulars. In this case it was pretty obvious the HTTP Verb Put wasn’t allowed here:
Fiddler3

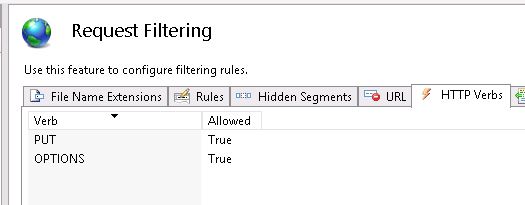
The fix was fairly complicated because there are good reasons for servers to block HTTP Verbs that aren’t in use, so we had to make the case PUT was required for the Publishing Service to work (and then add HTTP Verb blocking at a different layer of the implementation). We also found the OPTIONS HTTP verb was crucial for Publishing Service work using the same Fiddler technique described above. We ended up needing to permit both those 2 additional HTTP Verbs to enable proper Sitecore Publishing Service activity.

This isn’t really the final way to permit those verbs in a real production implementation, but it’s close enough for the purposes of this blog . . . check out the IIS Request Filtering options we needed to explicitly permit for this CM server to communicate to the Publishing Service running on the same VM host:
Fiddler4

Sitecore’s had API service layers that depended on these HTTP Verbs for many years, so I shouldn’t be surprised to find the Publishing Service is also making use of them. I just never connected the two together. This customer, too, is very security conscious and features are thoroughly locked-down unless you explicitly enable them. This Sitecore 8 project isn’t otherwise using the Sitecore Sevices Client, for example, or the Item API. The good news is these PUT and OPTIONS exceptions are only internal to the system and not opened up outside to the public internet thanks to firewalls and other networking.

I will also note that we briefly explored the idea of customizing the HTTP Verbs the Publishing Service made use of  . . . but you can imagine threading the needle of dependencies through that stack of libraries would be a very tough challenge.
Which Solr Node Is Responding to My Sitecore Query?

In working with Sitecore + Solr, eventually you may need to determine which Solr server responded to a specific query in order to validate Solr replication or to compare Solr responses across machines. If you can’t imagine a reason why you’d want to do this, you’re probably fortunate and should maybe go buy a lottery ticket instead of reading this blog post 🙂

Brute Force Method with Solr Master/Slave

If you’re working with Solr master/slave behind a load-balancer, or with multiple slaves behind a load-balancer, I haven’t found a reliable way of determining which Solr server responded to a particular query besides the brute force method of comparing Sitecore and Solr logs. Specifically, from the Sitecore logs in Data\logs\Search.Logs.[Timestamp].txt you should see something like the following for each query:

Sitecore’s Query Log

15:11:48 INFO Serialized Query – ?q=(_template:(f613d8a8d9324b5f84516424f49c9102) AND (-_name:(“__Standard Values”) AND _language:(en-US)))&start=0&rows=1&fl=*,score&fq=_indexname:(sitecore_web_index)&sort=searchdate_tdt desc

Solr’s Query Log

You can cross-reference this Sitecore log data with Solr logs (like S:\solr-4.10.4\sitecore\logs\solr.log):

INFO – 2018-08-01 15:11:48.514; org.apache.solr.core.SolrCore; [sitecore_web_index] webapp=/solr path=/select params={q=(_template:(f613d8a8d9324b5f84516424f49c9102)+AND+(-_name:(“__Standard+Values”)+AND+_language:(en-US)))&fl=*,score&start=0&fq=_indexname:(sitecore_web_index)&sort=searchdate_tdt+desc&rows=1&version=2.2} hits=2958 status=0 QTime=16

It’s tedious to match up the exact query and time in these logs, but the Solr node with the matching record will reveal which one serviced the request.

Now, one can craft some PowerShell to scrounge the Sitecore and Solr logs and determine where we have matches — crazy as it may sound — but I’m not interested in sharing all that here. It’s academic to read the two logs and look for matches, anyway, so I’ll move on to the Solr Cloud scenario that is more interesting and forward-looking since Sitecore is steadily progressing towards full Solr Cloud support across the board.

Solr Cloud Debug Query Command

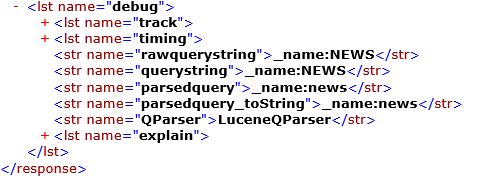
Solr Cloud supports a debug command where you append debug=true to the URL and Solr includes diagnostic output in the results. For example, a RESTful query to Solr like http://10.215.118.28:8983/solr/sitecore_web_index_shard1_replica2/select?q=_name%3ANEWS&wt=xml&indent=true&amp;debug=true. Using the XML formatting, debug=true adds something like this to the response from Solr:

Capture

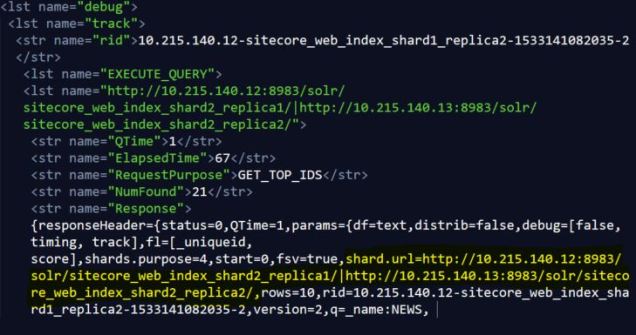
There can be interesting tidbits in each of those debug sections, but I’m going to focus on the track node that shares information about the different phases of the distributed request Solr is making. Under the “EXECUTE_QUERY” item is a “name” attribute that will specify which Solr nodes, shards, and replica were involved in responding to the query, for example:

<lst name=”http://10.215.140.12:8983/solr/sitecore_web_index_shard2_replica1/|http://10.215.140.13:8983/solr/sitecore_web_index_shard2_replica2/”>

I’ve also found the “shard.url” value of the Response (nested under the EXECUTE_QUERY data) to share the same information. It’s possible that’s more reliable across Solr versions etc, but something to keep an eye on. Here’s a fragment of the XML response for the debug information:

Capture

A careful reader might point out that the “rid”  value includes the IP address of the server responding to the request, but this is designed to be the “request ID” that traces the query through Solr’s various moving parts — I wouldn’t rely on the “rid” to tell you the source for the response, though, as it could be changing across versions.

Here’s a quick run through of the other diagnostic data in that EXECUTE_QUERY data that I know about:

  1. QTime: the number of milliseconds it took Solr to execute a search with no regard for time spent sending a response across the network etc
  2. ElapsedTime: the number of milliseconds from when the query was sent
    to Solr until the time the client gets a response. This includes QTime, assembling the response, transmission time, etc.
  3. NumFound: the count of results

There is a ton to all this and we’re only scratching the surface, but as Sitecore gets more serious about scalable search with Solr, we’re all going to be learning a lot more about this in the months and years to come!

Sitecore and SearchMaxResults for Solr

I’ve consulted with a number of Sitecore implementations in the last month or two that had a variety of challenges with Sitecore integration with Solr. Solr is a powerful distributed system with a variety of angles of interest to Sitecore. I wanted to take this chance to comment on a Sitecore setting that can have a significant impact on how Sitecore search functions, but is easily overlooked. The setting is defined in Sitecore.ContentSearch.config and it’s called ContentSearch.SearchMaxResults. The XML comment for this setting is straight-forward, here’s how it’s presented in that file:

snip

There’s a lot to digest in that xml comment above. One could read it and assume “this can be set but it is best kept as the default” means this shouldn’t be altered, but in my experience that can be problematic.

The .Net int.MaxValue constant is 2,147,483,647. If you leave this setting at the default (so “”), one is telling Solr to return up to 2,147,483,647 results in a single response to a query, which we’ve observed in some cases to cause significant performance problems (Solr will fetch the large volume of records from disk and write them to the Solr response causing IO pressure etc.) It’s not always the case since it really comes down to the number of documents one is querying from Solr, but this sets up the potential for a virtually unbounded Solr query.

It’s interesting to trace this setting through Sitecore and into Solr, and it sheds light on how these two complex systems work together. Fun, right!? I cooked up the diagram below that shows an overview of how Sitecore and Solr work together in completing search queries:

snipp

Each application has it’s own logging which will help trace activity between the systems.

The Sitecore ContentSearch Provider for Solr relies on Solr.Net for connectivity to Solr. It’s common for .Net libraries to copy their open source equivalents from the Java world (like Log4J has a .Net port for logging named Log4net, Lucene has a .Net port for search called Lucene.Net, etc). Solr.Net, however, is not a port of the Solr Java application to .Net. Instead, Solr.Net is a wrapper for the main Solr API elements that can be easily called by .Net applications. When it comes to Sitecore’s ContentSearch Provider for Solr, Solr.Net is Sitecore’s bridge for getting data to and from the Solr application.

Just an aside: some projects do creative things with Solr search and Sitecore, and for certain scenarios it’s necessary to bypass Solr.Net and use the REST API directly from Sitecore. This write-up focuses on a conventional Sitecore -> Solr.Net -> Solr pattern, but I wanted to acknowledge that it’s not the only pattern.

Tracking ContentSearch.SearchMaxResults in Sitecore

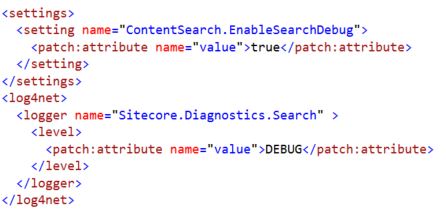
On the Sitecore side, one can see the ContentSearch.SearchMaxResults setting in the Sitecore logs when you turn up the diagnostics to get more granular data; this isn’t a configuration that’s recommended for using beyond a discrete troubleshooting session as the amount of data it can generate can be significant . . . but here’s how you dial up the diagnostic data Sitecore reports about queries:

snip3

If you run a few queries that exercise your Sitecore implementation code that queries Solr, you can review the contents of the Search log in the Sitecore /data directory and find entries such as:

INFO Solr Query – ?q=associated_docs:(“\*A5C71A21-47B5-156E-FBD1-B0E5EFED4D33\*”)&rows=2147483647&fq=_indexname:(domain_index_web)

or

INFO  Solr Query – ?q=((_fullpath:(\/sitecore/content/Branches/ABC/*) AND _templates:(d0351826b1cd4f57ac05816471ba3ebc)))&rows=2147483647&fq=_indexname:(domain_index_web)

The .Net int.MaxValue 2147483647 is what Sitecore, through Solr.Net, is specifying as the number of rows to return from this query. For Solr cores with only a few hundred results matching this query, it’s not that big a deal because the query has a fairly small universe to process and retrieve. If you have 100,000 documents, however, that’s a very heavy query for Solr to respond to and it will probably impact the performance of your Sitecore implementation.

Tracking ContentSearch.SearchMaxResults in Solr

Solr has it’s own logging systems and this 2147483647 value can be seen in these logs once Solr has completed the API call. In a default Solr installation, the logs will be located at server/logs (check your log4j.properties file if you don’t know for sure where your logs are being stored) and you can a open up the log and scan for our ContentSearch.SearchMaxResults setting value. You’ll see entries such as:

INFO  – 2018-03-26 21:20:19.624; org.apache.solr.core.SolrCore; [domain_index_web] webapp=/solr path=/select params={q=(_template:(a6f3979d03df4441904309e4d281c11b)+AND+_path:(1f6ce22fa51943f5b6c20be96502e6a7))&fl=*,score&fq=_indexname:(domain_index_web)&rows=2147483647&version=2.2} hits=2681 status=0 QTime=88

  • The above Solr query returned 2,681 results (hits) and the QTime (time elapsed between the arrival of the query request to Solr and the completion of the request handler) was 88 milliseconds. This is probably no big deal as it relates to the ContentSearch.SearchMaxResults, but you don’t know if this data will increase over time…

INFO  – 2018-03-26 21:20:19.703; org.apache.solr.core.SolrCore; [domain_index_web] webapp=/solr path=/select params={q=((((include_nav_xml_b:(True)+AND+_path:(00ada316e3e4498797916f411bc283cf)))+AND+url_s:[*+TO+*])+AND+(_language:(no-NO)+OR+_language:(en)))&fl=*,score&fq=_indexname:( domain_index_web)&rows=2147483647&version=2.2} hits=9 status=0 QTime=16

  • The above Solr query returned 9 results (hits) and the QTime was 16 milliseconds. This is unlikely a problem when it comes to ContentSearch.SearchMaxResults.

 INFO  – 2018-03-26 21:20:19.812; org.apache.solr.core.SolrCore; [domain_index_web] webapp=/solr path=/select params={q=(_template:(8ed95d51A5f64ae1927622f3209a661f)+AND+regionids_sm:(33ada316e3e4498799916f411bc283cf))&fl=*,score&fq=_indexname:(domain_index_web)&rows=2147483647&version=2.2} hits=89372 status=0 QTime=1600

  • The above Solr query returned 89,372 results (hits) and the QTime was 1600 milliseconds. Look out. This is the type of query that could easily cause problems based on the Sitecore ContentSearch.SearchMaxResults setting as the volume of data Solr is working with is getting large. That query time is already climbing high and that’s a lot of results for Sitecore to require in a single request.

The impact of retrieving so many documents from Solr can cause a cascade of difficulties besides just the handling of the query. Solr caches the query results in memory and if you request 1,000,000 documents you could also be caching 1,000,000 million documents. Too much of this activity and it can stress Solr to the breaking point.

Best Practices

There is no magic value to set for ContentSearch.SearchMaxResults other than not “”. General best practice when retrieving lots of data from most any system is to use paging. It’s recommended to do that for Sitecore ContentSearch queries, too. A general recommendation would be to set a specific value for the ContentSearch.SearchMaxResults setting, such as “500” or “1000”. This should be thoroughly tested, however, as limiting the search results for an implementation that isn’t properly using search result paging can lead to inconsistent behavior across the site. Areas such as site maps, general site search, and other areas with implementation logic that could assume all the search results are available in a single request deserve special attention when tuning this setting.

What About Noisy Solr Neighbors?

I’ve worked on some implementations where Solr was a resource shared between a variety of Sitecore implementations. One project, in this example, might set ContentSearch.SearchMaxResults to “2000” for their Sitecore sites while another project sets a value of “500” – but what if there’s a third organization making use of the same Solr resources and that project doesn’t explicitly set a value for ContentSearch.SearchMaxResults? That one project leaves the setting at the “” default, so it uses the .Net int.MaxValue. This is a classic noisy neighbor problem where shared services become a point of vulnerability to all the consuming applications. The one project with “” for ContentSearch.SearchMaxResults could be responsible for dragging Solr performance down across all the sites.

Solr is an extensible platform much like Sitecore, and in some ways even more so. In Sitecore one extends pipelines or overrides events to achieve the customizations you desire; the same general idea can be applied to Solr – you just use Java with Solr instead of C#.

In this case, our concern being unbounded Solr queries, we can use an extension to a search component (org.apache.solr.handler.component.SearchComponent) to introduce our custom logic into the Solr query processing. In our case, we want to enforce limits to the number of rows a query can request. This would be a safety net in case an un-tuned Sitecore implementation left a ContentSearch.SearchMaxResults setting at the default.

Some care must be taken in how this is introduced into the Solr execution context and where exactly the custom logic is handled. This topic is all covered very well, along with sample code etc, at https://jorgelbg.wordpress.com/2015/03/12/adding-some-safeguard-measures-to-solr-with-a-searchcomponent/. For an enterprise Solr implementation with a variety of Sitecore consumers, a safety measure such as this could be vital to the general stability and perf of the platform – especially if one doesn’t have control over the specific Sitecore projects and their use (or abuse!) of the ContentSearch.SearchMaxResults setting. Maybe file this under best practices for governing Sitecore implementations with shared Solr infrastructure.

The Odyssey of Sitecore Commerce Staging’s Reliance on SQL CE 3.5

The Problem

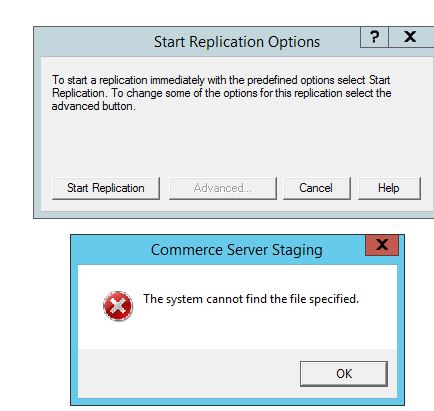
I recently completed a fun journey triaging a set of self-inflicted wounds around Sitecore Commerce Staging.  The rest of Sitecore Commerce 8.2.1 ran as expected except for when I setup the Sitecore Commerce Staging between a CM and CD tier . . . I would get an odd “The system cannot find the file specified” dialog box immediately after trying to start a basic Staging replication project:

cannot find the File

And when I say that pop-up appears immediately after clicking the “Start Replication” button, I mean it — we’re talking almost instantaneously.

Background

I’ll pause here just to lay out why one cares about Commerce Server Staging with Sitecore.  The Commerce Staging documentation is on MSDN in a variety of places, and Sitecore is using this sub-system to manage Commerce specific content promotion (such as product catalog changes, promotion codes, etc).  As explained in the summary on CommerceSDN.Sitecore.net :

The role of Commerce Server Staging is to move Commerce Server data between environments or sites.

If the master and web environments are pointing to the same Commerce Server site instance, as soon as data is changed on the master environment, it will be published to web. To ensure that Commerce Server data is not published unexpectedly, it is strongly recommended that you have one Commerce Server site for your Content Management (CM) environment, a separate Commerce Server site for your Content Delivery (CD) environment, and then use Commerce Server [Staging] to move the data.

I added the [Staging] to the final sentence above, as I think it’s pretty key to understanding the topic.

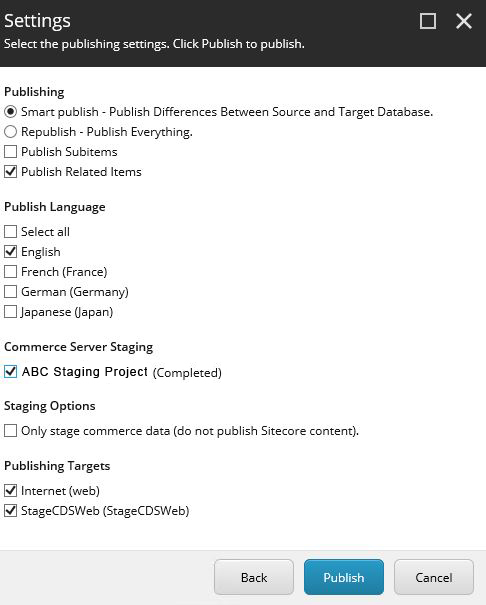
Commerce Server Staging is the vehicle one uses to manage Commerce data the same way we manage marketing data in the rest of Sitecore.  We create and update Sitecore CMS content in a “master” SQL Server database and then promote it to “web” with a Sitecore Publish operation . . . then we create and update Sitecore commerce content via the Sitecore CM and promote changes to the live website via Sitecore Staging operations.  The Sitecore Publish process has been extended with Sitecore Commerce to include Staging, so you can run it as a single integrated process.  Note the “Commerce Server Staging” checkbox included in the Sitecore Publish dialog below:

StagingPublishDialog

It’s usually magic and just works — but I was not able to run any type of Commerce Staging operation, so I needed to peel back the curtain and learn a bit more about how to troubleshoot Commerce Staging.

The Solution

This write-up on Monitoring Commerce Staging laid the foundation for my eventual resolution.  Before exploring that angle, however, I reviewed this write-up with some basic pitfalls on Commerce Staging . . . of course there’s this gem about DCOM permissions (& my write-up on applying that setting when the GUID isn’t readily available) . . . Sitecore’s KB site has some suggestions and the Community.Sitecore.net has some suggestions. There are hundreds of nooks and crannies one can investigate here, so it took me some time to discover what was going on.  Hopefully, my adventure can inform others, so here goes . . .

  1. The link about monitoring Commerce Staging (https://msdn.microsoft.com/en-us/library/ms961837(v=cs.70).aspx) talks about ways to configure what is logged and how to view the events of the Staging process.  I digested this info and, while the write-up assumes some old IIS configurations, I discovered the C:\Program Files (x86)\Commerce Server 11\Staging directory has two folders of particular interest to me: Data and Events.  The Events folder has .mdb and .ldb files (yes, that’s Microsoft Access) that form a type of localized Event Log for Commerce Staging; the Data folder has a StagingLog.sdf file — .sdf is a format used by SQL Server Compact Edition
  2. I opened the Access database and found that it didn’t have any helpful information for my scenario.  My “cannot find the file specified” exception was not in evidence there . . . but there is some interesting meta-data captured in that Access MDB for Staging.  This Events folder appeared to be a dead-end.
  3. I used LinqPad to analyze the StagingLog.sdf file (turns out Commerce Staging uses SQL CE 3.5 edition), and I learned two key things:
    • This StagingLog.sdf file was essentially empty — no data was being written to it when I tried to start a Commerce Staging operation
    • I couldn’t use LINQPad on the server running Commerce Staging as I didn’t have the proper SQL CE 3.5 drivers, but when I moved it to my developer machine I could view the .sdf file without issue.  Interesting . . .
  4. My next step was to use ProcMon (available at https://docs.microsoft.com/en-us/sysinternals/downloads/procmon) and compare a process capture from my environment that raised the exception with a properly functioning Commerce Staging environment.  This took some trial and error, but filtering on the CSSsrv.exe helped me focus on the task at hand.
    • The properly functioning Staging environment had a lot of activity with the StagingLog.sdf file.  We’re talking hundreds of operations.  The broken Staging environment had none.  Once I tracked ProcMon instruction sets 1:1 between the two environments I found the final piece of evidence I needed:

SqlCE

The highlighted area above, C:\Program Files (x86)\Microsoft SQL Server Compact Edition\v3.5\sqlceer35EN.dll entries, were entirely missing from the initialization process of my broken Commerce Staging environment.

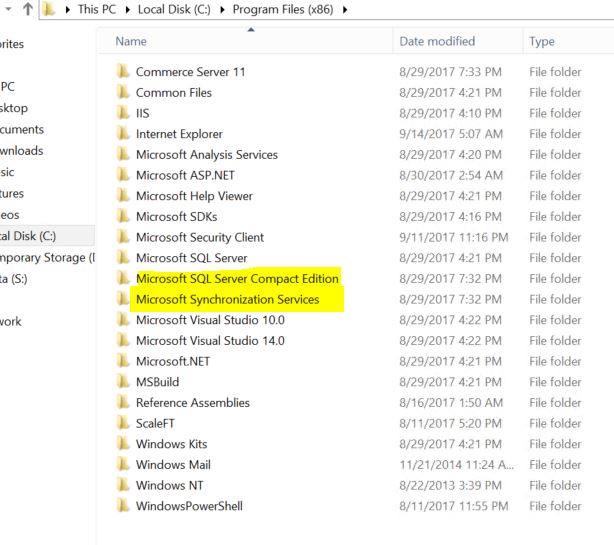
The lightbulbs finally went off for me, and I did a quick comparison of the C:\Program Files (x86) directories of the two servers.  There were key components missing from the environment where Staging wasn’t working, and it revolved around SQL Server Compact Edition.  Here’s a highlight showing what obviously wasn’t on the server in question:

dirs

Neither MS SQL Server Compact Edition nor MS Synchronization Services were installed to this server.  I did some further research, and learned that the CommerceServer.exe should fold in these elements with any Commerce install, so I needed to do a repair installation with the CommerceServer.exe and that added SQL Server CE and other dependencies necessary to solve the issue.

Our PowerShell that installs the CommerceServer.exe must not have been using a properly elevated account, or this was done with a manual execution of the installer that didn’t use the proper administrative credentials.  Everything worked fine after I completed the repair install of Commerce Server.

There are some additional items to point out here:

  • Based on my testing, the CommerceServer.exe may exclude some key Staging dependencies if it’s not run in a proper Administrator context.  I thought it was written in the docs somewhere, but I don’t see it in Sitecore’s documentation on installing Commerce Server .exe — running that EXE in the context of a local admin account is crucial to the success of that process.  I use this account and the shift + right-click -> Run as different user” option when launching the CommerceServer.exe manually, and this has been successful for me.
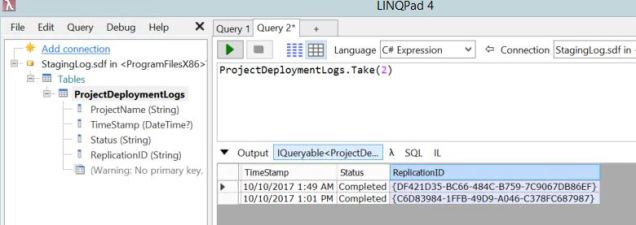
  • If you’re like me, and love the post-script to a good story,  here’s what LINQPad shows for that StagingLog.sdf once you’ve run a couple successful Staging operations:

Linqpad

  • I think additional take aways from this write-up are:
    • there’s an MS Access database in C:\Program Files (x86)\Commerce Server 11\Staging\Events that could be a source of interesting diagnostic info on your Sitecore Commerce Staging activities
    • there’s an SQL CE database in C:\Program Files (x86)\Commerce Server 11\Staging\Data that could be a source of interesting diagnostic info on your Sitecore Commerce Staging activities

Sitecore and Solr Diagnostics: Pings and Logs

Like I mentioned last week in this post about Sitecore + Solr – Lucene, I wanted to share some other posts about running Sitecore with Solr.  While 2017 is shaping up to be the year of Azure for Sitecore, I also expect Solr to continue to grow in prominence across Sitecore implementations.

Solr exposes lots of information about it’s current condition and state, but it’s not that easy to access.  I’ll take a run at shedding light on some of the monitoring basics and let’s see where this goes:

Ping

A proof-of-life for Solr is usually part of an implementation, whether it’s for a load-balancer in front of Solr nodes or some other form of a health check.  This is typically done via the Solr /admin/ping endpoint so a request to http://localhost:8983/solr/sitecore_master_index/admin/ping?wt=json would result in something like:

{
  "responseHeader": {
    "status": 0,
    "QTime": 0,
    "params": {
      "q": "{!lucene}*:*",
      "distrib": "false",
      "df": "text",
      "rows": "10",
      "wt": "json",
      "echoParams": "all"
    }
  },
  "status": "OK"
}

I chose the JSON response writer for Solr (more about this at https://wiki.apache.org/solr/CoreQueryParameters).  Solr’s default response writer is XML and returns a lot more formatting text around the exact same information.

There is actually a lot of flexibility around this ping RequestHandler for Solr (check out the documentation).  I’m scratching the surface here since, for a plain vanilla Sitecore install, knowing that ping will either be “OK” or return the failing HTTP error code is usually sufficient.

Logging

So the ping is easy, but only reports OK or NOT OK.  It doesn’t provide any real granularity around that determination . . . so let’s assume you’ve got a Solr server that is not returning an “OK” status from the ping.  If you’ve restarted Solr on the server, and Solr still isn’t responding “OK” then it’s probably time to dig into the Solr logs.  Solr defaults to using a variation of Log4j to capture trace logs, so the documentation on Log4j can be helpful (just note that currently Log4j is on version 2.x, while the Solr versions I’ve worked on [up to Solr 6.2] are all using the earlier Log4j 1.2 version [log4j-1.2.17.jar]).

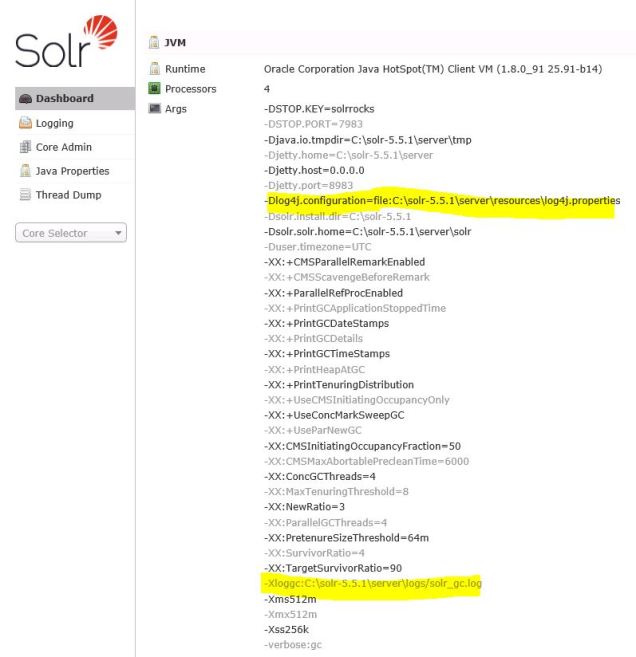
Solr will use the file server\resources\log4j.properties as the basis for Log4j configuration, but this can vary depending on how you’ve installed Solr.   If you need to determine where this file is configured in your implementation, you can check the Dashboard of the Solr web admin tool.  This shows the runtime configuration settings for Solr.  I’ve highlighted the two log related settings in my example:

solrlogsettings

The -Xloggc parameter is for Java Garbage Collection (GC) logging and usually not something you would consider Solr specific, but good to know it exists if that becomes a topic to investigate.

Inside a standard log4j.properties file one finds the following:

#  Logging level
solr.log=logs
log4j.rootLogger=INFO, file

log4j.appender.CONSOLE=org.apache.log4j.ConsoleAppender

log4j.appender.CONSOLE.layout=org.apache.log4j.EnhancedPatternLayout
log4j.appender.CONSOLE.layout.ConversionPattern=%-4r %-5p (%t) [%X{collection} %X{shard} %X{replica} %X{core}] %c{1.} %m%n

#- size rotation with log cleanup.
log4j.appender.file=org.apache.log4j.RollingFileAppender
log4j.appender.file.MaxFileSize=50MB
log4j.appender.file.MaxBackupIndex=9

#- File to log to and log format
log4j.appender.file.File=${solr.log}/solr.log
log4j.appender.file.layout=org.apache.log4j.EnhancedPatternLayout
log4j.appender.file.layout.ConversionPattern=%d{yyyy-MM-dd HH:mm:ss.SSS} %-5p (%t) [%X{collection} %X{shard} %X{replica} %X{core}] %c{1.} %m\n

log4j.logger.org.apache.zookeeper=WARN
log4j.logger.org.apache.hadoop=WARN

# set to INFO to enable infostream log messages
log4j.logger.org.apache.solr.update.LoggingInfoStream=OFF

That configuration file is fairly self-explanatory.  Adjust the rootLogger value off of INFO if you’d prefer DEBUG or WARN or some other level.  I think I have just one other note on the above configuration file:

the MaxFileSize setting of older Solr installations was set to 4 MB; this is pretty small for a production instance, so the example above (using a Solr 6 default) of using 50 MB makes more sense for production.

If one peeks into a solr log file, there’s a couple common record types by default.  Here’s what a query logged for Solr looks like:

webapp=/solr path=/select params={df=text&distrib=false&fl=_uniqueid&fl=score&shards.purpose=4&start=0&fsv=true&fq=_indexname:(sitecore_testing_index)&shard.url=http://10.225.240.243:8983/solr/sitecore_testing_index_shard2_replica2/|http://10.225.240.72:8983/solr/sitecore_testing_index_shard2_replica1/&rows=2147483647&version=2&q=__is_running_b:(True)&NOW=1481640759343&isShard=true&wt=javabin} hits=0 status=0 QTime=0

After the query parameters, the log reports the number of hits for the query, the status (0 means “OK”) and the duration for this request in milliseconds.  Note that Solr queries are logged after they complete . . . so if you have a run-away query you may not see it in the log with the standard configuration.  More about this at a later time, perhaps.

Updates to Solr are logged using a similar pattern, they will start with webapp=/solr path=/update.

It’s possible to  setup Log4j to create more narrowly targeted logs.  For example, you could have queries and updates written to different logs for easier troubleshooting (see this example for the nitty gritty on targeting Solr logs).

If your project doesn’t want all this “noise” about each update and query to Solr, or there’s a concern that all this logging could become a bottleneck, you can set the log level for Solr to WARN and only see warnings and errors in your logs.  You will be sacrificing that query performance data, however, so you’ll not have a record to review for slow performing queries . . . so a recommended practice is to trigger a “WARN” condition when a query exceeds a certain threshold.  In solrconfig.xml add a <slowQueryThresholdMillis> element to the query section of solrconfig.xml:

<query>
<slowQueryThresholdMillis>2000</slowQueryThresholdMillis>

Any queries that take longer than 2 seconds (2000 milliseconds defined above) will be logged as “slow” queries at the WARN level.  Note that this setting would need to be duplicated for every core that’s defined in Solr (meaning, with Sitecore’s one core per index  approach you’ll have several solrconfig.xml files to touch).

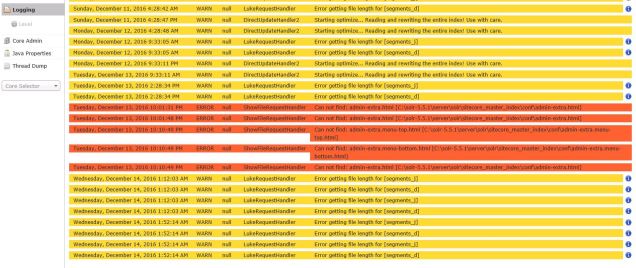
Besides these fairly routine entries in Solr logs, there will also be exceptions and sometimes using the Logging section of the Solr web admin provides a convenient way to see the most recent set of these exceptions.  This is a convenient way of viewing Log4j items for your Solr implementation in near real-time; note if you make changes to the Level setting from this web interface, it is not persistent after a Solr restart.

Example of a Solr logging section in the web admin interface:

loggingsolradmin

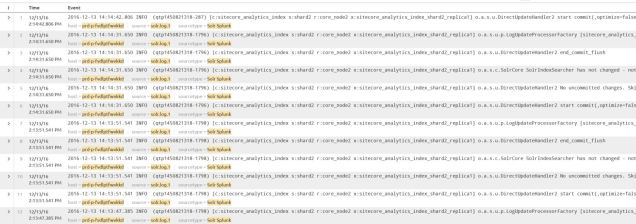
There are a number of other ways to review the Log4j data, old-school Chainsaw is still around, some I know some prefer Otros log viewer, but I’ve had success with Splunk (see screen shot below):

splunkforSolr.JPG

I’ll get into other methods for diagnostic work with Solr in the next post.