In working with Sitecore + Solr, eventually you may need to determine which Solr server responded to a specific query in order to validate Solr replication or to compare Solr responses across machines. If you can’t imagine a reason why you’d want to do this, you’re probably fortunate and should maybe go buy a lottery ticket instead of reading this blog post 🙂
Brute Force Method with Solr Master/Slave
If you’re working with Solr master/slave behind a load-balancer, or with multiple slaves behind a load-balancer, I haven’t found a reliable way of determining which Solr server responded to a particular query besides the brute force method of comparing Sitecore and Solr logs. Specifically, from the Sitecore logs in Data\logs\Search.Logs.[Timestamp].txt you should see something like the following for each query:
Sitecore’s Query Log
15:11:48 INFO Serialized Query – ?q=(_template:(f613d8a8d9324b5f84516424f49c9102) AND (-_name:(“__Standard Values”) AND _language:(en-US)))&start=0&rows=1&fl=*,score&fq=_indexname:(sitecore_web_index)&sort=searchdate_tdt desc
Solr’s Query Log
You can cross-reference this Sitecore log data with Solr logs (like S:\solr-4.10.4\sitecore\logs\solr.log):
INFO – 2018-08-01 15:11:48.514; org.apache.solr.core.SolrCore; [sitecore_web_index] webapp=/solr path=/select params={q=(_template:(f613d8a8d9324b5f84516424f49c9102)+AND+(-_name:(“__Standard+Values”)+AND+_language:(en-US)))&fl=*,score&start=0&fq=_indexname:(sitecore_web_index)&sort=searchdate_tdt+desc&rows=1&version=2.2} hits=2958 status=0 QTime=16
It’s tedious to match up the exact query and time in these logs, but the Solr node with the matching record will reveal which one serviced the request.
Now, one can craft some PowerShell to scrounge the Sitecore and Solr logs and determine where we have matches — crazy as it may sound — but I’m not interested in sharing all that here. It’s academic to read the two logs and look for matches, anyway, so I’ll move on to the Solr Cloud scenario that is more interesting and forward-looking since Sitecore is steadily progressing towards full Solr Cloud support across the board.
Solr Cloud Debug Query Command
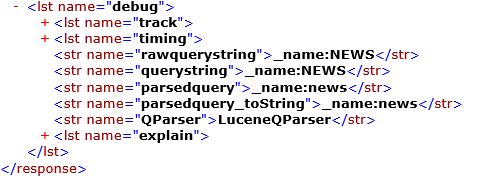
Solr Cloud supports a debug command where you append debug=true to the URL and Solr includes diagnostic output in the results. For example, a RESTful query to Solr like http://10.215.118.28:8983/solr/sitecore_web_index_shard1_replica2/select?q=_name%3ANEWS&wt=xml&indent=true&debug=true. Using the XML formatting, debug=true adds something like this to the response from Solr:

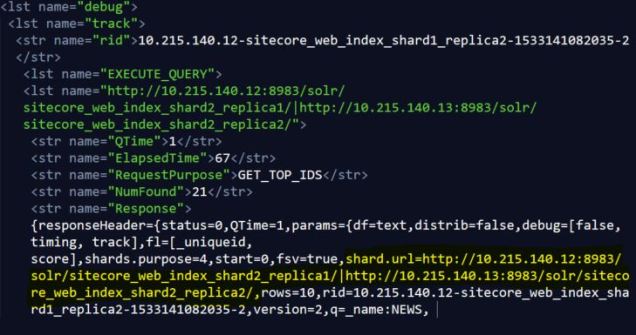
There can be interesting tidbits in each of those debug sections, but I’m going to focus on the track node that shares information about the different phases of the distributed request Solr is making. Under the “EXECUTE_QUERY” item is a “name” attribute that will specify which Solr nodes, shards, and replica were involved in responding to the query, for example:
<lst name=”http://10.215.140.12:8983/solr/sitecore_web_index_shard2_replica1/|http://10.215.140.13:8983/solr/sitecore_web_index_shard2_replica2/”>
I’ve also found the “shard.url” value of the Response (nested under the EXECUTE_QUERY data) to share the same information. It’s possible that’s more reliable across Solr versions etc, but something to keep an eye on. Here’s a fragment of the XML response for the debug information:

A careful reader might point out that the “rid” value includes the IP address of the server responding to the request, but this is designed to be the “request ID” that traces the query through Solr’s various moving parts — I wouldn’t rely on the “rid” to tell you the source for the response, though, as it could be changing across versions.
Here’s a quick run through of the other diagnostic data in that EXECUTE_QUERY data that I know about:
- QTime: the number of milliseconds it took Solr to execute a search with no regard for time spent sending a response across the network etc
- ElapsedTime: the number of milliseconds from when the query was sent
to Solr until the time the client gets a response. This includes QTime, assembling the response, transmission time, etc.
- NumFound: the count of results
There is a ton to all this and we’re only scratching the surface, but as Sitecore gets more serious about scalable search with Solr, we’re all going to be learning a lot more about this in the months and years to come!


