Azure AppGateways and Sitecore’s Use of X-Forwarded-For

I’m writing this up so I have a convenient reference for future projects — it looks like there’s a bug with Sitecore’s Analytics library and how it handles IP addresses through an Azure Application Gateway.

Sitecore relies on the X-Forwarded-For HTTP header when a load balancer sits between the Sitecore IIS server and the client browser.  I rarely encounter Sitecore implementations without load balancers, they’re critical for performance, security, resiliency during upgrades, etc.  During some Sitecore testing behind the App Gateway, we observed the following message in the Sitecore logs:

Cannot parse a valid IP address from X-Forwarded-For header

About this time, a friend of mine — and another smart Sitecore guy “Bryan Furlong” — commented to me how his current project ran into port numbers in their IP addresses for xDB purposes . . . so we committed to investigating.

Using Reflector, I confirmed this specific “Cannot parse a valid IP address from” exception message appears in the Process method in the Sitecore.Analytics.Pipelines.CreateVisits.XForwardedFor class:

try
{
    address = IPAddress.Parse(ipFromHeader);
}
catch (FormatException)
{
    Log.Warn($"Cannot parse a valid IP address from {forwardedRequestHttpHeader} header.", this);
    return;
}

It looked like the Azure App Gateway, a specific variety of load balancer for Azure implementations, includes port numbers with the IP address when relaying traffic.  This port number is not handled well by the Sitecore.Analytics processing code, and — in this particular case — led to the failure of GeoIP resolution for an Azure Sitecore implementation.

To verify what was going on, I added the X-Forwarded-For field as a custom field to the IIS Logs and compared the contents.

xfor

Behind the Azure App Gateway, “X-Forwarded-For” fields in the IIS Logs show data such as:

  • 50.14.232.1:45712
  • 74.14.167.1:28336

By comparison, behind the other types of load balancers I looked at, the IIS Logs show data such as:

  • 46.246.335.99
  • 92.77.214.84

Looks like confirmation of the issue!

One cool aspect of working at Rackspace is access to lots of smart people across the industry, and we verified with the App Gateway team at Microsoft that X-Forwarded-For is a comma separated list of <I{:Port> and changing the presence of the port number is NOT currently configurable.  We would need our Sitecore implementation to strip off the port portion.

The Sitecore customization to address this is fairly straight-forward.  Instead of the default CreateVisit pipeline defined as follows in Sitecore.Analytics.Tracking.config . . .

      <createVisit>
        ...
        <processor type="Sitecore.Analytics.Pipelines.CreateVisits.XForwardedFor, Sitecore.Analytics">
          <HeaderIpIndex>0</HeaderIpIndex>
        </processor>
        ...
      </createVisit>

. . . one must introduce their own library and override the GetIpFromHeader method to account for a port number:

public class XForwardedFor : Sitecore.Analytics.Pipelines.CreateVisits.XForwardedFor
    {
        protected override string GetIpFromHeader(string theHeader)
        {
            string[] source = theHeader.Split(new char[] { ',' });
            int headerIpIndex = base.HeaderIpIndex;
            string str = (headerIpIndex < source.Length) ? source[headerIpIndex] : source.LastOrDefault<string>();
            if (string.IsNullOrEmpty(str))
            {
                return null;
            }
            string[] strArray2 = str.Split(new char[] { ':' }, StringSplitOptions.RemoveEmptyEntries);
            if (strArray2.Length > 1)
            {
                str = strArray2[0];
            }
            return str.Trim();
        }
    }

In talking through this all with Sitecore support, they confirmed it’s a product bug and tracked as 132442 issue.

To ensure our custom code replaces the default Sitecore pipeline code, the following patch include file is important:

<?xml version="1.0" encoding="utf-8" ?>
<configuration xmlns:patch="http://www.sitecore.net/xmlconfig/" xmlns:xdt="http://schemas.microsoft.com/XML-Document-Transform">
  <sitecore>
    <pipelines>
      <createVisit>
        <processor type="Our.Custom.Namespace.And.Class.XForwardedFor,Our.Custom.Assembly.dll"
              patch:instead="*[@type='Sitecore.Analytics.Pipelines.CreateVisits.XForwardedFor, Sitecore.Analytics']" />
      </createVisit>
    </pipelines>
  </sitecore>
</configuration>

Update December 10, 2018 – I learned that Sitecore shares an official patch for this issue at https://sitecore.app.box.com/s/g9g8mu7orb3qkbc7dct2i351qaarhwes, so if you want to review their Sitecore.Support.Analytics.Pipelines.CreateVisits.XForwardedFor to address this issue, check it out.

Slice & Dice Solr Indexes for Sitecore with Banana UI

I’m fresh off a week at the Lucene-Solr Revolution conference and training, and it was a real eye-opener for me!  I have many pages of notes, so many potential blog posts bridging the Solr/Sitecore divide, and saw up-close the vibrancy of the Solr community.  There’s so much innovation going on there . . . it was really inspiring.

One take away from the experience was how Solr has a variety of tools for index analysis that could be really useful for Sitecore scenarios.  I know there’s some basic Sitecore diagnostic pages that will shed light on some index internals for Lucene or Solr, and the Solr admin UI has lots of powerful features, but I wanted to share in this blog post a bit about Banana UI and what it can do for us in the Sitecore world.

What Banana UI Can Do

Before explaining how Banana UI works, it’s probably most useful to show a screen shot of it in action:

banana0

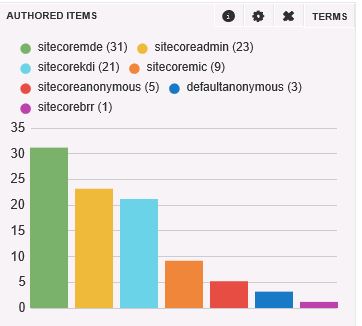
The above shows 3 custom dashboard widgets (Banana calls them panels) that are processing against my sitecore_master_index for a LaunchSitecore 8.1 demo instance I have.  I quickly contrived the above 3 visualizations, using just some sample data, but they represent a bit of the possible options using this free tool.

The first dashboard charts parsedcreatedby_s values for the LaunchSitecore site (I set it to exclude the 15,000 items authored by the Sitecore admin using a Solr filter of q=-parsedupdatedby_s:sitecoreadmin).

banana2.JPG

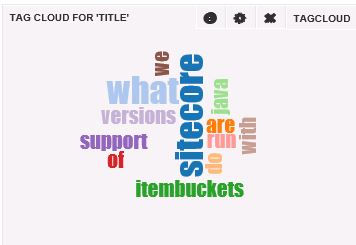
The second dashboard is a basic word cloud derived from title_t in the LaunchSitecore site index.  Banana UI makes it easy to inspect the underlying query for a visualization, so I could find the baseline query executed against Solr for this was q=*%3A*&wt=json&rows=0&fq=__smallcreateddate_tdt:[2011-10-17T19:49:57.000Z%20TO%202016-10-17T19:49:57.000Z]&facet=true&facet.field=title_t&facet.limit=20).

banana3.JPG

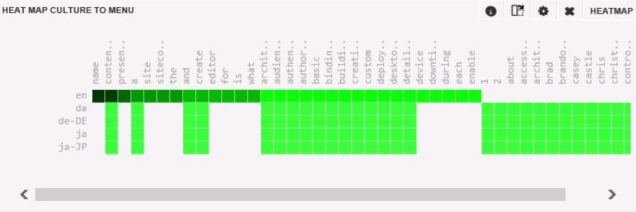
The third dashboard shows a heat map of culture_s and menu_title_t.  I wanted to show the heatmap since it’s a great way of visualizing data correlations, and in this case it illustrates how heavily LaunchSitecore relies on the en culture for item content.

banana4

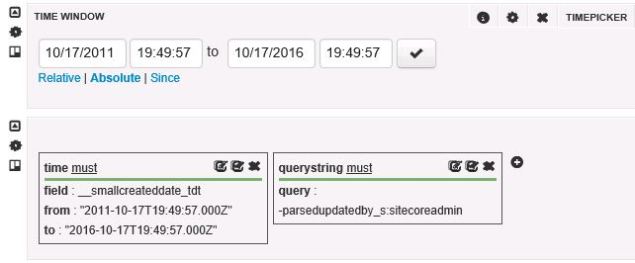
The crux of the Banana UI is time series of data, although it has powerful applications for other data too.  For my example dashboards, I setup a time window spanning 5 years so it included all the origin data for LaunchSitecore (has it really been 5 years since that project got off the ground?).  Like I said above, I wanted to exclude the 15,000+ pieces of sitecore\admin content since it would dominate the chart in dashboard 1.  With Banana UI, it’s all driven through the single page application:

banana1.JPG

I’m just getting started with Banana as a tool for examining customer Solr implementations for Sitecore . . . I can envision a lot of interesting angles to this, whether using the sitecore_analytics_index for xDB visualizations or metadata analysis with canned searches of the sitecore_web_index.  There’s probably a use case for everyone: business users wanting to keep tabs on a few key terms in the corpus, super-users doing site-wide analysis, certainly for technical users curious about term frequencies or looking to test out some Solr faceting with zero coding and a nice visual interface for feedback.  Banana UI belongs on the radar of every Sitecore implementation making use of Solr.

How To Put Banana UI To Use

Quoting from the Lucidwork’s GitHub repo for Banana:

The Banana project was forked from Kibana, and works with all kinds of time series (and non-time series) data stored in Apache Solr. It uses Kibana’s powerful dashboard configuration capabilities, ports key panels to work with Solr, and provides significant additional capabilities, including new panels that leverage D3.js.

The goal is to create a rich and flexible UI, enabling users to rapidly develop end-to-end applications that leverage the power of Apache Solr.

Here’s a key reference on how to generally configure Banana for Solr.

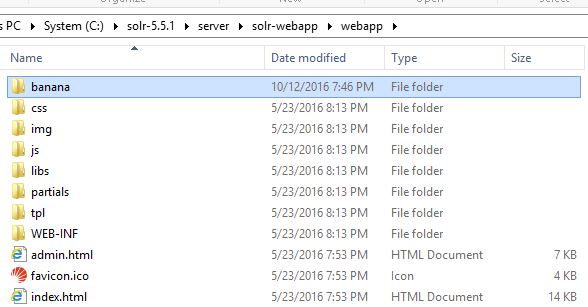
I’m not going to repeat the reference above, but the gist of it is to copy the Banana UI source into your solr-webapp directory and customize a couple settings (like the name of the Solr collection you want to analyze), then you’re ready to begin slicing and dicing the Solr information:

banana

One can access the Banana UI  via http://your solr server:your solr port/solr/banana/ (or solr/banana/src/index.html if the redirects aren’t setup).  I found Chrome to be the best browser for visualizing the data.  You can save pre-built dashboards for ease of sharing, or build dashboards out ad-hoc.

While Banana (and the original, Kibana) is designed for viewing event and log data in real-time, it’s charting components work great as a facade in front of Solr and it deploys as a simple stand-alone directory as part of the Solr web app.  I’m looking forward to seeing how I can further shape Sitecore specific dashboards with Banana, as currently I’m really just scratching the surface.