Which Solr Node Is Responding to My Sitecore Query?

In working with Sitecore + Solr, eventually you may need to determine which Solr server responded to a specific query in order to validate Solr replication or to compare Solr responses across machines. If you can’t imagine a reason why you’d want to do this, you’re probably fortunate and should maybe go buy a lottery ticket instead of reading this blog post 🙂

Brute Force Method with Solr Master/Slave

If you’re working with Solr master/slave behind a load-balancer, or with multiple slaves behind a load-balancer, I haven’t found a reliable way of determining which Solr server responded to a particular query besides the brute force method of comparing Sitecore and Solr logs. Specifically, from the Sitecore logs in Data\logs\Search.Logs.[Timestamp].txt you should see something like the following for each query:

Sitecore’s Query Log

15:11:48 INFO Serialized Query – ?q=(_template:(f613d8a8d9324b5f84516424f49c9102) AND (-_name:(“__Standard Values”) AND _language:(en-US)))&start=0&rows=1&fl=*,score&fq=_indexname:(sitecore_web_index)&sort=searchdate_tdt desc

Solr’s Query Log

You can cross-reference this Sitecore log data with Solr logs (like S:\solr-4.10.4\sitecore\logs\solr.log):

INFO – 2018-08-01 15:11:48.514; org.apache.solr.core.SolrCore; [sitecore_web_index] webapp=/solr path=/select params={q=(_template:(f613d8a8d9324b5f84516424f49c9102)+AND+(-_name:(“__Standard+Values”)+AND+_language:(en-US)))&fl=*,score&start=0&fq=_indexname:(sitecore_web_index)&sort=searchdate_tdt+desc&rows=1&version=2.2} hits=2958 status=0 QTime=16

It’s tedious to match up the exact query and time in these logs, but the Solr node with the matching record will reveal which one serviced the request.

Now, one can craft some PowerShell to scrounge the Sitecore and Solr logs and determine where we have matches — crazy as it may sound — but I’m not interested in sharing all that here. It’s academic to read the two logs and look for matches, anyway, so I’ll move on to the Solr Cloud scenario that is more interesting and forward-looking since Sitecore is steadily progressing towards full Solr Cloud support across the board.

Solr Cloud Debug Query Command

Solr Cloud supports a debug command where you append debug=true to the URL and Solr includes diagnostic output in the results. For example, a RESTful query to Solr like http://10.215.118.28:8983/solr/sitecore_web_index_shard1_replica2/select?q=_name%3ANEWS&wt=xml&indent=true&debug=true. Using the XML formatting, debug=true adds something like this to the response from Solr:

Capture

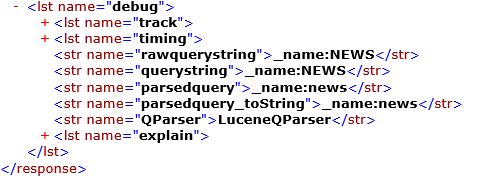
There can be interesting tidbits in each of those debug sections, but I’m going to focus on the track node that shares information about the different phases of the distributed request Solr is making. Under the “EXECUTE_QUERY” item is a “name” attribute that will specify which Solr nodes, shards, and replica were involved in responding to the query, for example:

<lst name=”http://10.215.140.12:8983/solr/sitecore_web_index_shard2_replica1/|http://10.215.140.13:8983/solr/sitecore_web_index_shard2_replica2/”>

I’ve also found the “shard.url” value of the Response (nested under the EXECUTE_QUERY data) to share the same information. It’s possible that’s more reliable across Solr versions etc, but something to keep an eye on. Here’s a fragment of the XML response for the debug information:

Capture

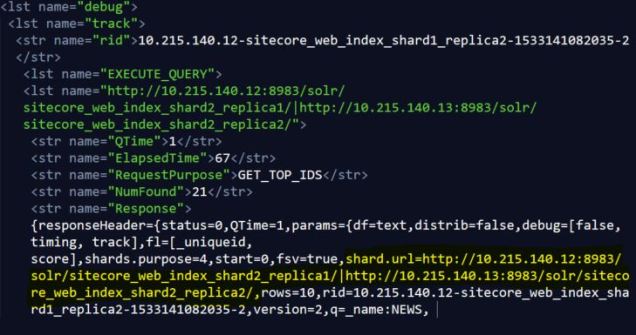
A careful reader might point out that the “rid”  value includes the IP address of the server responding to the request, but this is designed to be the “request ID” that traces the query through Solr’s various moving parts — I wouldn’t rely on the “rid” to tell you the source for the response, though, as it could be changing across versions.

Here’s a quick run through of the other diagnostic data in that EXECUTE_QUERY data that I know about:

  1. QTime: the number of milliseconds it took Solr to execute a search with no regard for time spent sending a response across the network etc
  2. ElapsedTime: the number of milliseconds from when the query was sent
    to Solr until the time the client gets a response. This includes QTime, assembling the response, transmission time, etc.
  3. NumFound: the count of results

There is a ton to all this and we’re only scratching the surface, but as Sitecore gets more serious about scalable search with Solr, we’re all going to be learning a lot more about this in the months and years to come!

Sitecore and SearchMaxResults for Solr

I’ve consulted with a number of Sitecore implementations in the last month or two that had a variety of challenges with Sitecore integration with Solr. Solr is a powerful distributed system with a variety of angles of interest to Sitecore. I wanted to take this chance to comment on a Sitecore setting that can have a significant impact on how Sitecore search functions, but is easily overlooked. The setting is defined in Sitecore.ContentSearch.config and it’s called ContentSearch.SearchMaxResults. The XML comment for this setting is straight-forward, here’s how it’s presented in that file:

snip

There’s a lot to digest in that xml comment above. One could read it and assume “this can be set but it is best kept as the default” means this shouldn’t be altered, but in my experience that can be problematic.

The .Net int.MaxValue constant is 2,147,483,647. If you leave this setting at the default (so “”), one is telling Solr to return up to 2,147,483,647 results in a single response to a query, which we’ve observed in some cases to cause significant performance problems (Solr will fetch the large volume of records from disk and write them to the Solr response causing IO pressure etc.) It’s not always the case since it really comes down to the number of documents one is querying from Solr, but this sets up the potential for a virtually unbounded Solr query.

It’s interesting to trace this setting through Sitecore and into Solr, and it sheds light on how these two complex systems work together. Fun, right!? I cooked up the diagram below that shows an overview of how Sitecore and Solr work together in completing search queries:

snipp

Each application has it’s own logging which will help trace activity between the systems.

The Sitecore ContentSearch Provider for Solr relies on Solr.Net for connectivity to Solr. It’s common for .Net libraries to copy their open source equivalents from the Java world (like Log4J has a .Net port for logging named Log4net, Lucene has a .Net port for search called Lucene.Net, etc). Solr.Net, however, is not a port of the Solr Java application to .Net. Instead, Solr.Net is a wrapper for the main Solr API elements that can be easily called by .Net applications. When it comes to Sitecore’s ContentSearch Provider for Solr, Solr.Net is Sitecore’s bridge for getting data to and from the Solr application.

Just an aside: some projects do creative things with Solr search and Sitecore, and for certain scenarios it’s necessary to bypass Solr.Net and use the REST API directly from Sitecore. This write-up focuses on a conventional Sitecore -> Solr.Net -> Solr pattern, but I wanted to acknowledge that it’s not the only pattern.

Tracking ContentSearch.SearchMaxResults in Sitecore

On the Sitecore side, one can see the ContentSearch.SearchMaxResults setting in the Sitecore logs when you turn up the diagnostics to get more granular data; this isn’t a configuration that’s recommended for using beyond a discrete troubleshooting session as the amount of data it can generate can be significant . . . but here’s how you dial up the diagnostic data Sitecore reports about queries:

snip3

If you run a few queries that exercise your Sitecore implementation code that queries Solr, you can review the contents of the Search log in the Sitecore /data directory and find entries such as:

INFO Solr Query – ?q=associated_docs:(“\*A5C71A21-47B5-156E-FBD1-B0E5EFED4D33\*”)&rows=2147483647&fq=_indexname:(domain_index_web)

or

INFO  Solr Query – ?q=((_fullpath:(\/sitecore/content/Branches/ABC/*) AND _templates:(d0351826b1cd4f57ac05816471ba3ebc)))&rows=2147483647&fq=_indexname:(domain_index_web)

The .Net int.MaxValue 2147483647 is what Sitecore, through Solr.Net, is specifying as the number of rows to return from this query. For Solr cores with only a few hundred results matching this query, it’s not that big a deal because the query has a fairly small universe to process and retrieve. If you have 100,000 documents, however, that’s a very heavy query for Solr to respond to and it will probably impact the performance of your Sitecore implementation.

Tracking ContentSearch.SearchMaxResults in Solr

Solr has it’s own logging systems and this 2147483647 value can be seen in these logs once Solr has completed the API call. In a default Solr installation, the logs will be located at server/logs (check your log4j.properties file if you don’t know for sure where your logs are being stored) and you can a open up the log and scan for our ContentSearch.SearchMaxResults setting value. You’ll see entries such as:

INFO  – 2018-03-26 21:20:19.624; org.apache.solr.core.SolrCore; [domain_index_web] webapp=/solr path=/select params={q=(_template:(a6f3979d03df4441904309e4d281c11b)+AND+_path:(1f6ce22fa51943f5b6c20be96502e6a7))&fl=*,score&fq=_indexname:(domain_index_web)&rows=2147483647&version=2.2} hits=2681 status=0 QTime=88

  • The above Solr query returned 2,681 results (hits) and the QTime (time elapsed between the arrival of the query request to Solr and the completion of the request handler) was 88 milliseconds. This is probably no big deal as it relates to the ContentSearch.SearchMaxResults, but you don’t know if this data will increase over time…

INFO  – 2018-03-26 21:20:19.703; org.apache.solr.core.SolrCore; [domain_index_web] webapp=/solr path=/select params={q=((((include_nav_xml_b:(True)+AND+_path:(00ada316e3e4498797916f411bc283cf)))+AND+url_s:[*+TO+*])+AND+(_language:(no-NO)+OR+_language:(en)))&fl=*,score&fq=_indexname:( domain_index_web)&rows=2147483647&version=2.2} hits=9 status=0 QTime=16

  • The above Solr query returned 9 results (hits) and the QTime was 16 milliseconds. This is unlikely a problem when it comes to ContentSearch.SearchMaxResults.

 INFO  – 2018-03-26 21:20:19.812; org.apache.solr.core.SolrCore; [domain_index_web] webapp=/solr path=/select params={q=(_template:(8ed95d51A5f64ae1927622f3209a661f)+AND+regionids_sm:(33ada316e3e4498799916f411bc283cf))&fl=*,score&fq=_indexname:(domain_index_web)&rows=2147483647&version=2.2} hits=89372 status=0 QTime=1600

  • The above Solr query returned 89,372 results (hits) and the QTime was 1600 milliseconds. Look out. This is the type of query that could easily cause problems based on the Sitecore ContentSearch.SearchMaxResults setting as the volume of data Solr is working with is getting large. That query time is already climbing high and that’s a lot of results for Sitecore to require in a single request.

The impact of retrieving so many documents from Solr can cause a cascade of difficulties besides just the handling of the query. Solr caches the query results in memory and if you request 1,000,000 documents you could also be caching 1,000,000 million documents. Too much of this activity and it can stress Solr to the breaking point.

Best Practices

There is no magic value to set for ContentSearch.SearchMaxResults other than not “”. General best practice when retrieving lots of data from most any system is to use paging. It’s recommended to do that for Sitecore ContentSearch queries, too. A general recommendation would be to set a specific value for the ContentSearch.SearchMaxResults setting, such as “500” or “1000”. This should be thoroughly tested, however, as limiting the search results for an implementation that isn’t properly using search result paging can lead to inconsistent behavior across the site. Areas such as site maps, general site search, and other areas with implementation logic that could assume all the search results are available in a single request deserve special attention when tuning this setting.

What About Noisy Solr Neighbors?

I’ve worked on some implementations where Solr was a resource shared between a variety of Sitecore implementations. One project, in this example, might set ContentSearch.SearchMaxResults to “2000” for their Sitecore sites while another project sets a value of “500” – but what if there’s a third organization making use of the same Solr resources and that project doesn’t explicitly set a value for ContentSearch.SearchMaxResults? That one project leaves the setting at the “” default, so it uses the .Net int.MaxValue. This is a classic noisy neighbor problem where shared services become a point of vulnerability to all the consuming applications. The one project with “” for ContentSearch.SearchMaxResults could be responsible for dragging Solr performance down across all the sites.

Solr is an extensible platform much like Sitecore, and in some ways even more so. In Sitecore one extends pipelines or overrides events to achieve the customizations you desire; the same general idea can be applied to Solr – you just use Java with Solr instead of C#.

In this case, our concern being unbounded Solr queries, we can use an extension to a search component (org.apache.solr.handler.component.SearchComponent) to introduce our custom logic into the Solr query processing. In our case, we want to enforce limits to the number of rows a query can request. This would be a safety net in case an un-tuned Sitecore implementation left a ContentSearch.SearchMaxResults setting at the default.

Some care must be taken in how this is introduced into the Solr execution context and where exactly the custom logic is handled. This topic is all covered very well, along with sample code etc, at https://jorgelbg.wordpress.com/2015/03/12/adding-some-safeguard-measures-to-solr-with-a-searchcomponent/. For an enterprise Solr implementation with a variety of Sitecore consumers, a safety measure such as this could be vital to the general stability and perf of the platform – especially if one doesn’t have control over the specific Sitecore projects and their use (or abuse!) of the ContentSearch.SearchMaxResults setting. Maybe file this under best practices for governing Sitecore implementations with shared Solr infrastructure.

Sitecore Publishing Data Through the EventQueue

Our Challenge

We work with a variety of Sitecore implementations at Rackspace, and sometimes we need to do a surgical task without requiring customers to install anything in particular, trigger app pool recycles, or other changes to an environment.  One such example came up today.

We needed to provide insight into a recent Sitecore publishing operation, but the customer didn’t have logging or other instrumentation showing what was published by whom, published where, and when.  While there may be Sitecore Marketplace modules and other solutions to this sort of challenge, they require customizations or at least package installations by the customer — and none of them can go back in time to answer the question about “who published XYZ in the last few hours?”

Preferably, by using the dedicated Publish log set to INFO in Sitecore, one can get at a ton of handy publishing information . . . and this is our general recommendation for implementations (provided logs aren’t retained for so long that they cause a space concern on disk).  In this case, however, the publish log wasn’t an option and so we had to get creative.

Our Solution

For this scenario, knowing the customer is using a global publishing pattern for Sitecore that we like to employ at Rackspace, we turned to the Sitecore EventQueue since we couldn’t rely on the Publish log.  Even though the EventQueue is mainly about propagating events to other Sitecore instances, we can take advantage of the fact that publishing events are some of those operations that run through the EventQueue.  We can run a query like the following to get a rough handle on what has been recently published:

SELECT Created as [Publish Timestamp]
        --, Username as [Initiator] -- not for distribution!
        , CAST(SUBSTRING(HASHBYTES('SHA1', UserName),1,3) as bigint)  as [Hashed Initiator]
        , IIF(CHARINDEX('"TargetDatabaseName":"pubTarget1"', InstanceData)>0,'1','0') AS [To 1]
        , IIF(CHARINDEX('"TargetDatabaseName":"pubTarget2"', InstanceData)>0,'1','0') AS [To 2]
        , IIF(CHARINDEX('"TargetDatabaseName":"pubTarget3"', InstanceData)>0,'1','0') AS [To 3]
        , IIF(CHARINDEX('"TargetDatabaseName":"pubTarget4"', InstanceData)>0,'1','0') AS [To 4]
       , (LEN(InstanceData) - LEN(REPLACE(InstanceData, '"LanguageName"', ''))) / LEN('"LanguageName"') as [# of Langs] --this is a proxy for how heavy a publish is
        , InstanceData AS [Raw Data]
FROM EventQueue
WHERE EventType LIKE 'Sitecore.Publishing.StartPublishingRemoteEvent%'
ORDER BY Created DESC

Here’s a glance of what the data might look like . . .

pubDump

Explanations & Caveats

Regarding the query, we use an SHA hash of the Sitecore login instead of showing the login (Username) in plain text.  A plain text username could be a security concern, so we don’t want to email that or casually distribute it.  Instead of generic “pubTarget1” etc, one should name specific publishing targets defined in the implementation.  This tells us if a publish went out to all the targets or just selectively.  Our use of “# of Langs” is a way of seeing how much data went out with the publish . . . it’s not perfect, but in most cases we’ve found counting the number of “LanguageName” elements in the JSON to be a reasonable barometer.  When in doubt, the Raw Data can be used to get at lots of other details.  I’d use a JSON viewer to format the JSON; it will look something like:

{
  "ClientLanguage": "en",
  "EventName": "publish:startPublishing",
  "Options": [
    {
      "CompareRevisions": true,
      "Deep": false,
      "FromDate": "\/Date(1464134576584)\/",
      "LanguageName": "de-DE",
      "Mode": 3,
      "PublishDate": "\/Date(1464183788221)\/",
      "PublishRelatedItems": false,
      "PublishingTargets": [
        "{8E080626-DDC3-4EF4-A1A1-F0BE4A200254}"
      ],
      "RecoveryId": "cd00ba58-61cb-4446-82ae-356eaae71957",
      "RepublishAll": false,
      "RootItemId": "afde64e9-7176-43ad-a1f2-89162d8ba4cb",
      "SourceDatabaseName": "master",
      "TargetDatabaseName": "web"
    }
  ],
  "PublishingServer": "SCMASTER-1-CLONE",
  "StatusHandle": {
    "instanceName": "SCMASTER-1-CLONE",
    "m_handle": "e3b5831f-2698-41b5-9bf9-3d88a5238e5a"
  },
  "UserName": "sitecore\\notalegituser"
}

One key caveat to this SQL approach is that data in the Sitecore EventQueue doesn’t remain for long.  Depending on how one tunes their Sitecore.Tasks.CleanupEventQueue agent, EventQueue records might be available for only a few hours.  It’s certainly not a good source for long term publishing history!  This is another reason why using the Sitecore Publishing log is really the way to go — but again, that text log isn’t available to us in this scenario.

How Sitecore Phones Home (maybe)

A question came up today around the office: does Sitecore monitor their installation base via a phone-home mechanism of some kind?  It’s relevant in a number of ways.   One way being as we work on cloud installations and elastic models for Sitecore, what data might Sitecore have that we could leverage for tracking licensing compliance, utilization, etc.

There may be other ways Sitecore tracks their server activities, but I used Reflector on the Sitecore.sitecore.login namespace to find one very likely place where Sitecore implements a call-back to the mothership.  Here goes . . .

Using a clean Sitecore 8.1 rev 151207 installation, in the source for the sitecore/login/default.aspx page is the following mark-up.  Note the “display:none;” on line 1 that hides this div from view:

   1:      <div id="licenseOptions" style="display: none;">
   2:  <%--            <h2 class="form-signin-heading">License and browser information</h2>--%>
   3:              <div class="license-info-wrap">
   4:                <ul>
   5:                  <li>System information</li>
   6:                  <li>License holder <%# License.Licensee %></li>
   7:                  <li>License ID <%# License.LicenseID %></li>
   8:                  <li>Sitecore version <%# About.VersionInformation() %></li>
   9:                </ul>
  10:  
  11:                <iframe id="StartPage" runat="server" allowtransparency="true" frameborder="0" scrolling="auto"
  12:                      marginheight="0" marginwidth="0" style="display: none; height: 105px;"></iframe>
  13:  
  14:              </div>
  15:              <div class="login-link-wrap">
  16:                <a href="javascript:;" id="licenseOptionsBack" class="login-link">&lt; Back</a>
  17:              </div>
  18:  
  19:            </div>

If we remove the “display:none” and load the page, some interesting details about the environment are revealed.  On my local machine it appears like this:

displayed

That’s not particularly interesting, but if you return to the mark-up and examine the IFrame defined on line #11 named StartPage with the runat=server attribute, you might turn your attention to what’s going on server-side when this default.aspx page loads.

Reflector, or any decompiler, will show that Sitecore.sitecore.login.Default contains an OnInit method with various checks for authentication, databinding, and so on.  I’ll omit most of that method except for the one call that’s of interest here, as we look for a way our local Sitecore system could communicate back to Sitecore the company.

protected override void OnInit(EventArgs e)
{

this.RenderSdnInfoPage();

}

Diving into the RenderSdnInfoPage method, we have this:

   1:  private void RenderSdnInfoPage()
   2:  {
   3:      this.StartPage.Attributes["src"] = new UrlString(Settings.Login.SitecoreUrl) {
   4:          ["id"] = Sitecore.SecurityModel.License.License.LicenseID,
   5:          ["host"] = WebUtil.GetHostName(),
   6:          ["licensee"] = Sitecore.SecurityModel.License.License.Licensee,
   7:          ["iisname"] = WebUtil.GetIISName(),
   8:          ["st"] = WebUtil.GetCookieValue("sitecore_starttab", string.Empty),
   9:          ["sc_lang"] = Context.Language.Name,
  10:          ["v"] = About.GetVersionNumber(true)
  11:      }.ToString();
  12:      this.StartPage.Attributes["onload"] = "javascript:this.style.display='block'";
  13:  }

And now we’re in business!  Sitecore loads up various pieces of data from the local running Sitecore instance and appends it to the end of our URL that we inject into the src attribute of the IFrame.  That src attribute in a default Sitecore installation starts with http://sdn.sitecore.net/startpage.aspx (defined as the Login.SitecoreUrl configuration setting) and the rest of the URL is information communicated to Sitecore about this local instance.

For example, using my Firefox HTML Inspector, my generated IFrame source was as follows (know that I have altered identifying information about my license):

<i frame src=”http://sdn.sitecore.net/startpage.aspx?id=20150821010030&host=sc81rev151207&licensee=Not%20Really%20Sharing&iisname=b86449a111164a2cd9c37d771c094dce&st&sc_lang=en&v=8.1.151207” id=”StartPage” allowtransparency=”true” scrolling=”auto” marginheight=”0″ marginwidth=”0″ style=”display: block; height: 105px;” onload=”javascript:this.style.display=’block'” frameborder=”0″></i frame>

I think it’s a pretty safe bet that startpage.aspx on the sdn.Sitecore.net site has some logic running to catalog the querystring parameters and passively monitor what’s going on in the wild.

Tuning ClayTablet integration with Sitecore

I’ve had a couple opportunities to work with ClayTablet – Sitecore integrations.  For the most part, it’s very straight-forward and the ClayTablet package does the hard work.  Here’s an intro to what ClayTablet does with Sitecore, in case you’re not familiar.  It can be very convenient for organizations wanting professional translations of their web content without staffing their own native speakers in various languages!

Sync Translation

For starters, one should generally use the “Sync Translation” option on the Translation Options screen  in ClayTablet (either in the Bulk Translation wizard or the Automatic Item Export for Translation dialog).

synctrans

This sets ClayTablet to only send content fields that have changed since the last time an item was sent out for translation.  It can keep translation costs low and will limit the volume of information sent back-and-forth with ClayTablet.

Speaking of volume of information, the rest of these notes relate to how ClayTablet handles that Sitecore data.  If one has a lot of translations, 100s or 1000s of items, it’s important to optimize the integration to accommodate for that data flow.

SQL Server

ClayTablet runs from it’s own SQL Server database, so common sense guidance regarding SQL Server applies here.  A periodic maintenance plan (consistent with Sitecore’s tuning recommendation to the core Sitecore databases) is in order, which means setting up the following tasks to run weekly or monthly:

  • Check Database Integrity task
  • Rebuild Index Task
  • Update Statistics task

Setting the Recovery Mode to Simple for the ClayTablet database is also recommended, as it keeps the disk footprint to a minimum.  When ClayTablet is churning through 1000 or more translations, our Rackspace team has observed SQL Server Transaction logs growing out of control when using a Full Recovery Mode in SQL Server.

Sitecore Agents

ClayTablet uses a background process to handle moving translations both to and from the ClayTablet mother ship.  In CT3Translation.config on Sitecore CM servers, there’s UploadService and DownloadService agents defined something like:ct.JPG

The above image shows the default definitions for those Agents, and that means every 2 minutes these execute to handle moving data to or from Sitecore.  For a busy enterprise running Sitecore, the potential for 1000 or more translation items to process at any day or time from your CM server can be a concern — so it’s smart to consider altering that schedule so that the agents only run after hours or at a specific time (here’s a good summary of how to do that with a Sitecore agent).

Run ClayTablet Logic On Demand

In a case where one needs the ClayTablet agents to run during regular working hours, maybe in the situation where a high priority translation needs to be integrated ASAP, one could use an approach to adding a custom button in Sitecore to trigger a specific agent such as this.  This way ClayTablet wouldn’t casually run during busy periods on the CM, but you could kick off the UploadService and DownloadService on demand in special circumstances.

Building on the Run ClayTablet Logic on Demand idea, I think the slickest approach would be to use the ClayTablet SDK to query the ClayTablet message queues and determine if any translations are available for download.  This “peak ahead” into what ClayTablet would be bringing down into your Sitecore environment is only feasible through the SDK for ClayTablet.  This peak operation could run in the background every 2 minutes, for example, and alert content authors when translations are available; for example, maybe we add a button to the Sitecore ribbon that lets content authors run the ClayTablet DownloadService . . . and this button turns orange when the background agent peaks into the queue and finds translations are ready?  Content authors could then choose whether to initiate the DownloadService based on current business circumstances, or to wait and let the process run during the after-hours execution.

Evaluate for Yourself

ClayTablet keeps a log of processing activities along side the standard Sitecore logs, so I suggest familiarizing yourself with that log.  When troubleshooting a period of slow responsiveness on a Sitecore CM Server, we dug into the ClayTablet log and found a pattern such as this for the time period of the reported slowness:

16:42:38 INFO  5108 TranslatedSitecoreItem(s) need to handle
. . . much lower in the file . . .
18:29:04 INFO  3450 TranslatedSitecoreItem(s) need to handle
. . . much lower in the file . . .
20:59:10 INFO  1191 TranslatedSitecoreItem(s) need to handle
. . . you get the idea

There were many many log entries to sift through so the above is just a tiny digest.  It worked out that ClayTablet was crunching through about 1 TranlatedSitecoreItem every 5 seconds.  For 5 hours.  There are a series of activities that happen when an item is updated in Sitecore, index updates, workflow checks, save operations, etc.  It appeared that this steady stream of item manipulations and the cascade of those supporting events contributed to the load on the Sitecore CM server.

Like everything in Sitecore, this must be taken in context.  If an organization has small or infrequent translation activity, a trickle of ClayTablet updates isn’t much to worry about.  If there are 1,000 translated items coming in, however, and it’s a pattern that can repeat itself, it’s worth investing the energy in isolating those workloads to proper time windows.

Sitecore Logging to the database (part 3 – the performance picture)

This is part 3 of a series looking at customizing Sitecore to use logging to the database instead of the default file-based logging.  Refer to the first and second posts to get a full grasp of what I’m talking about here.

Asynchronicity

I alluded to this earlier, but the Log4Net ADONetAppender is not asynchronous, despite the buffering behavior discussed briefly in the second post in this series.   It stands to reason that logging to a database could negatively impact performance in a high-traffic situation with lots of logging. I recommend load testing with the same level of logging (WARN, ERROR, etc) to confirm the database logging does not introduce a performance bottleneck. Furthermore, it is worthwhile to run load tests with more verbose logging levels (such as INFO) to gauge any potential impact on the implementation. If a situation develops that requires a short-term change to the logging level, it’s impotant to understand repurcussions.

To provide for asynchronous logging through a custom ADONetAppender, one can build an asynchronous ADONetAppender for log4net such as https://github.com/cjbhaines/Log4Net.Async. This is not officially part of log4net nor officially Sitecore supported code, but is an open-source library for asynchronous logging based on log4net.  It’s one approach.  In preliminary tests, this project is written using a different version of log4net but updating it to be compatible with the log4net library referenced in Sitecore.Logging.dll should be possible (but beyond the scope of this write-up — but I may revisit this subject in a follow-up post).  This post has another promising example of building the asynchronous support to log4net: https://issues.apache.org/jira/browse/LOG4NET-407?jql=project%20%3D%20LOG4NET%20AND%20text%20~%20asynchronous.

Performance Analysis

Given the synchronous nature of the ADONetAppender in log4net, an examination of the performance impact of logging to the database is something we need to pay close attention to.

I did a modest analysis of page load times using the configurations described in this blog series. For this analysis, tests were run on a single computer (IIS combined with SQL Server) with JMeter exercising a Sitecore 7.2 site with a basic page writing a randomized INFO, WARN, and ERROR log message through the Sitecore.Diagnostics object. The code ran in the code-behind of the page_load event of a SubLayout with no component caching in effect. The BufferSize setting for the database appender was set to “1” to avoid any buffering effect (except in the specific test as noted below).

A pattern emerges showing a consistently faster page response time, albeit only slightly, for the Stored Procedure approach over the plain SQL text alternative.
Basic JMeter Page Load Analysis

  All Logging Disabled Plain SQL Logging Stored Proc SQL Logging File System Logging File & Stored Procedure Stored Proc with default BufferSize
20 Users (4,000 samples) 149 ms 180 ms 169 ms 158 ms 150 ms 147 ms
100 Users (40,000 samples) 840 ms 940 ms 884 ms 788 ms 936 ms 832 ms

The results show page load time in milliseconds. The data may say more about the workstation they were run on than about the performance of one logging implementation over another in a true high traffic situation, but the relative comparison is informative. Implementations should run their own tests to evaluate the particulars of their situation and environment, of course.

The basic analysis done here supports the concept of using a Stored Procedure when logging to a database instead of plain SQL, and taking advantage of the BufferSize setting. It’s interesting that having logging entirely disabled is nearly the same as logging to the database using a Stored Procedure and the default BufferSize value (512 messages buffered at a time). Again, these are conclusions drawn from a limited set of test data.

A general rule drawn from this analysis is that compared with the Sitecore installation defaults (logging to the local file system), logging to a database as we’ve gone over in this blog series may add .05 of a second (50 milliseconds) to the overall page processing time.  This is just a rough figure, but can serve as a starting point for planning a Sitecore logging strategy, and of course each implementation is different so running your own perf tests is absolutely critical!

Data Clean-Up

Typically, Sitecore automatically cleans up the text-based log files on a regular basis. One should have a clean-up routine in place for when logs are stored in the database, too. Consider adding a scheduled SQL Server Task to run clean-up logic such as:

DELETE CustomLog
WHERE [Date]<DATEADD(day,DATEDIFF(day,0,GETDATE()-30),0)

This example would remove data over 30 days old from the log file. One could schedule the frequency of the clean-up and the exact SQL to run based around the parameters of the implementation (and the SQL Server capacity and environment). Taking backups of the logged data before cleaning up could be in order, for example, if a responsibility exists to keep records for long-term audit purposes or just to be able to view changes over time.

Conclusion

This exploration of logging to the database in Sitecore is representative of what my group does a lot of at Sitecore.  A customer might have a single line on a requirements document stating: “log to the database” and then we get involved to understand why the customer wants to do it and how a customer might best make it happen.  Like nearly every facet of software development, things can get complicated beneath the surface.  Be suspicious of quick and easy answers, and this logging conversation is packed with nuance.  At some point (especially if a customer needs it!), I may elaborate on the asynchronous logging approach I sketched out above — but with the performance numbers I generated, I feel confident that database logging isn’t a non-starter for a high-traffic site.  The potential is there, of course, for database logging to be a bottleneck so one must be very deliberate in how or when to pursue it.

Sitecore Logging to the database (part 2 – earning the good developer badge)

This is a follow-up to my introduction on customizing Sitecore logging to use a database instead of a flat file.  This post covers some advancements over the basics in the first post, and sets the table for a conversation about performance and Sitecore database logging in the follow-up.

Centralizing the Connection String

If the database to write log output to is referenced in other capacities in the implementation, a database connection string pointing to the database will likely reside in app_config/ConnectionStrings.config. To avoid having multiple connection string configurations to the same database (one in the <log4net> definition and one in the <connectionStrings> definition), you may want to centralize the log4net connection string information and make exclusive use the ConnectionStrings.config entry. This eases maintenance and earns you the “good developer” badge for this functionality.

The following node should be added to the <appender> XML configuration, using our CustomDBAppender from the earlier post as the example:

<connectionStringName value="logRepository"/>

This can replace the entry for <param name=”connectionString” …

And in the App_Config/ConnectionStrings.config file one needs to add something such as the following:

<add name="logRepository" connectionString=" user id=[login];password=[pwd];Data Source=[server];Database=[CustomLogDB]" />

The DBAppender class in our example needs modifications to support this centralization of the connection string. Specifically, add a simple string property to the class to support the custom <connectionStringName/> node we added previously:

private string _cnString = String.Empty;
public string connectionStringName
{
  get
  {
    return _cnString;
  }
  set
  {
    _cnString = value;
  }
}

And to bring in the new connection string source to the DBAppender class, one should add an override of the ActivateOptions method as follows:

public override void ActivateOptions()
{
  this.ConnectionString = System.Configuration.ConfigurationManager.ConnectionStrings[connectionStringName].ConnectionString;
  base.ActivateOptions();
}

Using a Stored Procedure

The general performance benefits of using a Stored Procedure over plain SQL Command Text are well-known. When logging to the database, the potential for easier execution plan re-use in SQL Server is one reason to use a stored procedure; another good reason is the ability to limit the amount of “logic” within web.config – using a stored procedure can make maintenance easier. Again, let’s earn that “good developer practice” badge!

The steps to alter the configuration to use a stored procedure are straight forward:
1. Create a stored procedure in the database that will encapsulate the SQL INSERT statement:

CREATE PROCEDURE logFromSitecore
	@log_date		DateTime
	, @thread		varchar(255)
	, @log_level	varchar(255)
	, @logger		varchar(255)
	, @machine		varchar(4000)
	, @message		varchar(4000)
	, @custom		varchar(4000)
AS
BEGIN
	INSERT INTO CustomLog ([Date],[Thread],[Level],[Logger],[Message],[Machine],[Custom]) 
	VALUES (@log_date, @thread, @log_level, @logger, @message, @machine, @custom)
END

2. Change the XML configuration for the node in web.config to reference the stored procedure:

<appender name="DatabaseAppender" type="CustomDBAppender.DBAppenderWrapper, CustomDBAppender" >
<param name="CommandText" value="logFromSitecore" />
<param name="CommandType" value="StoredProcedure" />
...

This is all that’s required for the logging to now run through a stored procedure instead of using plain SQL command text. In the follow-up post about performance, I will return to this topic in more detail . . . but this covers the mechanics of using a stored procedure with your database logging.

Data Volume

No matter which approach one takes to managing the connection string or the question of stored procedures vs in-line SQL, managing the volume of data logged to the database is an important consideration.
Care should be taken in configuring the amount of data logged, just to guard against an overwhelming volume of database writes becoming a bottleneck. Log4net supports this in a number of ways, one method is the “priority” setting that is under the node in the log4net web.config definition. The “priority” setting filters out log messages below that value, so a < priority value=”WARN”/> would only write WARN messages and higher. You may want to consider using the ERROR value, even, to be more conservative about this. For production environments, I recommend updating the priority to WARN or ERROR for the configuration defined in section above. By default, Sitecore sets this to INFO. Change it to something like the following:

<root>
  <priority value="WARN"/>
  ...

BufferSize Setting

The ADONetAppender keeps a buffer of log messages in memory, and persists the messages to the database once the buffer is full. This buffer can be configured via the “bufferSize” setting () under the node in the log4net web.config definition. By default, Reflector tells me the value is 512. When checking the database table for a specific message, it’s important to know that a specific recent message might be buffered and not written to the database because of this setting. In a production environment, Sitecore recommends against setting a bufferSize value lower than the default (512), for performance reasons; a value of “1,” for example, would write every log message to the database as soon as it is generated and could create considerable traffic to the database. Depending on the environment, one may consider setting this bufferSize value higher than the default; in a development environment, however, a value of “1” may be desireable to have messages written immediately to the database.

Recognizing that the database appender is buffering messages, it’s conceivable that a server outage could result in a loss of any buffered messages that haven’t been written to the database. In such a circumstance, the logged activity could be vital to diagnosing the circumstances of the outage. With this scenario in mind, I recommend the following:

Maintain a minimal file-based Sitecore log on the server (keeping only the most recent 2 days, for example); this would have a better chance of capturing any log messages potentially lost due to a sudden outage.  In a hypothetical outage situation, one could resort to checking the file-based log on the server in question.  

ReconnectOnError Setting

The ADONetAppender has a “ReconnectOnError” setting which controls if this appender will try to reconnect to the database on error. The default behaviour is for the appender to not try to reconnect to the database if an error occurs (ReconnectOnError is false by default). Given a scenario where there’s a temporary database connection problem, subsequent logging events are discarded if the ReconnectOnError setting is set to false. To force the appender to attempt to reconnect to the database, set this property to true in the definition in web.config:

  <ReconnectOnError value="true"/>

Note: When the appender attempts to connect to the database there may be a delay of up to the connection timeout specified in the connection string. This delay will block the calling application’s thread. Until the connection can be reestablished this potential delay may occur multiple times. To mitigate such a scenario, one might consider introducing true asynchronicity into the ADONetAppender (more on this later).

OK, to recap these two posts on logging to the database with Sitecore:

  • Post one (enough to be dangerous):
    • The custom ADONetAppender Class
    • Log Database and Table
    • XML Configuration
  • Post two (earning the good developer badge):
    • Centralizing your ConnectionString
    • Using a Stored Procedure
    • Advanced settings to consider

In the third installment, I’ll address performance in some detail and asynchronicity.

Sitecore Logging to the database (part 1 — enough to be dangerous)

By default, Sitecore supports instrumentation/logging using the Log4Net library, and by default that output is written to the file system. This can be undesirable when it comes to troubleshooting or reviewing logged activity on secured environments, particularly in scaled multi-server implementations.  I was working with a Sitecore customer recently who was determined to use the database as the destination for logging (despite certain perf implications, more on this later).  They had a number of Content Delivery servers and having a consolidated view of the logged activity, easily accessible to Sitecore developers and queryable, drove this decision.

Note that in my capacity at Sitecore, I’m not advocating for logging to the database, but I am in a position to respond to the customer on how an implementation might tackle database logging if they were determined to do it.  Hopefully that’s enough caveats to satisfy the likes of Sitecore’s Chris Castle 🙂

ADONetAppender Class

To begin, the log4net.Appender.ADONetAppender is the standard log4Net object used to write log output to the database. Instead of using the default ADONetAppender, I recommend creating a custom class to extend the ADONetAppender. This provides a powerful mechanism for implementation specific logging logic, so that details not typically captured in a Sitecore log can be tracked (such as the executing machine, Sitecore user, URL, etc).

A basic customized ADONetAppender might look as follows:

namespace CustomDBAppender
{
  public class DBAppenderWrapper: log4net.Appender.ADONetAppender
  {
    protected override void Append(log4net.spi.LoggingEvent theEvent)
    {
      log4net.helpers.PropertiesCollection col = theEvent.Properties;
      if (!object.ReferenceEquals(Environment.MachineName, null))
      {
        col["machine"] = Environment.MachineName;
      }
      col["custom"] = "Best NHL team: Avalanche";
      base.Append(theEvent); 
   } 
  } 
}

(I will improve the code formatting on future posts, so just bare with me).

The expectation is that the customer would customise the Append method heavily.

One could add conditional logic based on the LoggingEvent.Level (Info, Error, etc), or tap into the Sitecore.Context object by referencing Sitecore.Kernel.dll with the project. Note: if one does reference Sitecore.Kernel.dll, be sure to reference the exact version used in your implementation to avoid conflicts.

CustomDBAppender Assembly

The previous section defines a CustomDBAppender assembly that compiles into CustomDBAppender.dll. There is one class in the assembly: DBAppenderWrapper. This .dll should be placed in the /bin directory of the Sitecore implementation.

Create log database and table

One needs a database and a table to store the logged output. Sitecore recommends against using a Sitecore Core, Master, or Web database for this purpose as those should be reserved for Sitecore application internals. Assuming one creates a database for this purpose named “CustomLogDB”, a table to store the logged output could be created with the following SQL script:

USE [CustomLogDB]
GO
CREATE TABLE [dbo].[CustomLog](
  [ID] [int] IDENTITY(1,1) NOT NULL,
  [Date] [datetime] NOT NULL,
  [Thread] [varchar](255) NOT NULL,
  [Level] [varchar](20) NOT NULL,
  [Logger] [varchar](255) NOT NULL,
  [Message] [varchar](4000) NOT NULL,
  [Machine] [varchar](4000) NULL,
  [Custom] [varchar](4000) NULL
) ON [PRIMARY]

The ID, Date, Thread, Level, Logger, and Message columns are defined to match the default Sitecore logged output. To support a custom implementation (any properties set in the CustomDBAppender.DBAppenderWrapper class), additional columns are warranted. In this example, “Machine” and “Custom” are defined in addition to the Sitecore standard logging columns.

One could build in extensibility here with an XML column type (and support very flexible logging schema with such an “CustomLoggedOutputAsXML” column), but I recommend a simple column structure with 1:1 mapping column to custom attribute unless circumstances warrant a more complicated table. Always evaluate the performance implications of complicating a table definition with XML column types, for example.

XML Configuration

Web.config, by default, defines the log4net settings that one must modify to output logging to a database. The log4net.Appender.SitecoreLogFileAppender Is defined by default under the <log4net> node. Add the following configuration just under the <log4net> node for the CustomDBAppender built in the step above:

<appender name="DatabaseAppender"
type="CustomDBAppender.DBAppenderWrapper, CustomDBAppender" >
<param name="ConnectionType"
value="System.Data.SqlClient.SqlConnection, System.Data, Version=2.0.0.0, Culture=neutral, PublicKeyToken=b77a5c561934e089" />
<param name="connectionString"
value="user id=[login];password=[pwd];Data Source=[server];Database=[CustomLogDB]" />
<param name="CommandText" value="INSERT INTO CustomLog ([Date],[Thread],[Level],[Logger],[Message],[Machine],[Custom]) VALUES (@log_date, @thread, @log_level, @logger, @message, @machine, @custom)" />
<param name="Parameter">
<param name="ParameterName" value="@log_date" />
<param name="DbType" value="DateTime" />
<param name="Layout" type="log4net.Layout.PatternLayout">
<param name="ConversionPattern" value="%d{yyyy&apos;-&apos;MM&apos;-&apos;dd HH&apos;:&apos;mm&apos;:&apos;ss&apos;.&apos;fff}" />
</param>
</param>
<param name="Parameter">
<param name="ParameterName" value="@thread" />
<param name="DbType" value="String" />
<param name="Size" value="255" />
<param name="Layout" type="log4net.Layout.PatternLayout">
<param name="ConversionPattern" value="%t" />
</param>
</param>
<param name="Parameter">
<param name="ParameterName" value="@log_level" />
<param name="DbType" value="String" />
<param name="Size" value="50" />
<param name="Layout" type="log4net.Layout.PatternLayout">
<param name="ConversionPattern" value="%p" />
</param>
</param>
<param name="Parameter">
<param name="ParameterName" value="@logger" />
<param name="DbType" value="String" />
<param name="Size" value="255" />
<param name="Layout" type="log4net.Layout.PatternLayout">
<param name="ConversionPattern" value="%c" />
</param>
</param>
<param name="Parameter">
<param name="ParameterName" value="@message" />
<param name="DbType" value="String" />
<param name="Size" value="4000" />
<param name="Layout" type="log4net.Layout.PatternLayout">
<param name="ConversionPattern" value="%m" />
</param>
</param>
<param name="Parameter">
<param name="ParameterName" value="@machine" />
<param name="DbType" value="String" />
<param name="Size" value="4000" />
<param name="Layout" type="log4net.Layout.PatternLayout">
<param name="ConversionPattern" value="%P{machine}" />
</param>
</param>
<param name="Parameter">
<param name="ParameterName" value="@custom" />
<param name="DbType" value="String" />
<param name="Size" value="4000" />
<param name="Layout" type="log4net.Layout.PatternLayout">
<param name="ConversionPattern" value="%P{custom}" />
</param>
</param>
</appender>

Note: Be sure to update the connectionstring property to the appropriate value for your environment.

The two parameter definitions for @machine and @custom use a different parameter definition (log4net.Layout.PatternLayout).

In addition to the Appender node, one must edit the <root> node for log4net that indicates where root logging output is directed. Out-of-the-box, Sitecore defines a root node as follows:

<root>
<priority value="INFO"/>
<appender-ref ref="LogFileAppender"/>
</root>

Using the example we’ve built through this document, the updated root node would be defined as follows:

<root>
<priority value="INFO"/>
<!-- custom db appender info:-->
<appender-ref ref="DatabaseAppender" />
<!--<appender-ref ref="LogFileAppender"/>-->
</root>

This completes the modifications necessary to the XML configuration.

This is just the end of the beginning.  This is enough to be dangerous with database logging in Sitecore, and I will shortly post follow-ups to this elaborating on considerations for the connection string, custom settings, asynchronicity, etc.