Like I mentioned last week in this post about Sitecore + Solr – Lucene, I wanted to share some other posts about running Sitecore with Solr. While 2017 is shaping up to be the year of Azure for Sitecore, I also expect Solr to continue to grow in prominence across Sitecore implementations.
Solr exposes lots of information about it’s current condition and state, but it’s not that easy to access. I’ll take a run at shedding light on some of the monitoring basics and let’s see where this goes:
Ping
A proof-of-life for Solr is usually part of an implementation, whether it’s for a load-balancer in front of Solr nodes or some other form of a health check. This is typically done via the Solr /admin/ping endpoint so a request to http://localhost:8983/solr/sitecore_master_index/admin/ping?wt=json would result in something like:
{
  "responseHeader": {
    "status": 0,
    "QTime": 0,
    "params": {
      "q": "{!lucene}*:*",
      "distrib": "false",
      "df": "text",
      "rows": "10",
      "wt": "json",
      "echoParams": "all"
    }
  },
  "status": "OK"
}
I chose the JSON response writer for Solr (more about this at https://wiki.apache.org/solr/CoreQueryParameters). Solr’s default response writer is XML and returns a lot more formatting text around the exact same information.
There is actually a lot of flexibility around this ping RequestHandler for Solr (check out the documentation). I’m scratching the surface here since, for a plain vanilla Sitecore install, knowing that ping will either be “OK” or return the failing HTTP error code is usually sufficient.
Logging
So the ping is easy, but only reports OK or NOT OK. It doesn’t provide any real granularity around that determination . . . so let’s assume you’ve got a Solr server that is not returning an “OK” status from the ping. If you’ve restarted Solr on the server, and Solr still isn’t responding “OK” then it’s probably time to dig into the Solr logs. Solr defaults to using a variation of Log4j to capture trace logs, so the documentation on Log4j can be helpful (just note that currently Log4j is on version 2.x, while the Solr versions I’ve worked on [up to Solr 6.2] are all using the earlier Log4j 1.2 version [log4j-1.2.17.jar]).
Solr will use the file server\resources\log4j.properties as the basis for Log4j configuration, but this can vary depending on how you’ve installed Solr. If you need to determine where this file is configured in your implementation, you can check the Dashboard of the Solr web admin tool. This shows the runtime configuration settings for Solr. I’ve highlighted the two log related settings in my example:
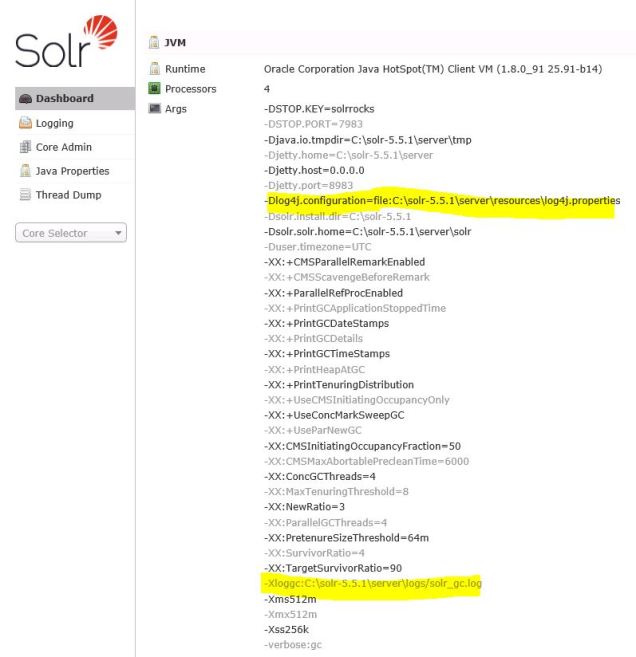
The -Xloggc parameter is for Java Garbage Collection (GC) logging and usually not something you would consider Solr specific, but good to know it exists if that becomes a topic to investigate.
Inside a standard log4j.properties file one finds the following:
#  Logging level
solr.log=logs
log4j.rootLogger=INFO, file

log4j.appender.CONSOLE=org.apache.log4j.ConsoleAppender

log4j.appender.CONSOLE.layout=org.apache.log4j.EnhancedPatternLayout
log4j.appender.CONSOLE.layout.ConversionPattern=%-4r %-5p (%t) [%X{collection} %X{shard} %X{replica} %X{core}] %c{1.} %m%n

#- size rotation with log cleanup.
log4j.appender.file=org.apache.log4j.RollingFileAppender
log4j.appender.file.MaxFileSize=50MB
log4j.appender.file.MaxBackupIndex=9

#- File to log to and log format
log4j.appender.file.File=${solr.log}/solr.log
log4j.appender.file.layout=org.apache.log4j.EnhancedPatternLayout
log4j.appender.file.layout.ConversionPattern=%d{yyyy-MM-dd HH:mm:ss.SSS} %-5p (%t) [%X{collection} %X{shard} %X{replica} %X{core}] %c{1.} %m\n

log4j.logger.org.apache.zookeeper=WARN
log4j.logger.org.apache.hadoop=WARN

# set to INFO to enable infostream log messages
log4j.logger.org.apache.solr.update.LoggingInfoStream=OFF
That configuration file is fairly self-explanatory. Adjust the rootLogger value off of INFO if you’d prefer DEBUG or WARN or some other level. I think I have just one other note on the above configuration file:
the MaxFileSize setting of older Solr installations was set to 4 MB; this is pretty small for a production instance, so the example above (using a Solr 6 default) of using 50 MB makes more sense for production.
If one peeks into a solr log file, there’s a couple common record types by default. Here’s what a query logged for Solr looks like:
webapp=/solr path=/select params={df=text&distrib=false&fl=_uniqueid&fl=score&shards.purpose=4&start=0&fsv=true&fq=_indexname:(sitecore_testing_index)&shard.url=http://10.225.240.243:8983/solr/sitecore_testing_index_shard2_replica2/|http://10.225.240.72:8983/solr/sitecore_testing_index_shard2_replica1/&rows=2147483647&version=2&q=__is_running_b:(True)&NOW=1481640759343&isShard=true&wt=javabin} hits=0 status=0 QTime=0
After the query parameters, the log reports the number of hits for the query, the status (0 means “OK”) and the duration for this request in milliseconds. Note that Solr queries are logged after they complete . . . so if you have a run-away query you may not see it in the log with the standard configuration. More about this at a later time, perhaps.
Updates to Solr are logged using a similar pattern, they will start with webapp=/solr path=/update.
It’s possible to setup Log4j to create more narrowly targeted logs. For example, you could have queries and updates written to different logs for easier troubleshooting (see this example for the nitty gritty on targeting Solr logs).
If your project doesn’t want all this “noise” about each update and query to Solr, or there’s a concern that all this logging could become a bottleneck, you can set the log level for Solr to WARN and only see warnings and errors in your logs. You will be sacrificing that query performance data, however, so you’ll not have a record to review for slow performing queries . . . so a recommended practice is to trigger a “WARN” condition when a query exceeds a certain threshold. In solrconfig.xml add a <slowQueryThresholdMillis> element to the query section of solrconfig.xml:
<query>…
<slowQueryThresholdMillis>2000</slowQueryThresholdMillis> |
Any queries that take longer than 2 seconds (2000 milliseconds defined above) will be logged as “slow” queries at the WARN level. Note that this setting would need to be duplicated for every core that’s defined in Solr (meaning, with Sitecore’s one core per index approach you’ll have several solrconfig.xml files to touch).
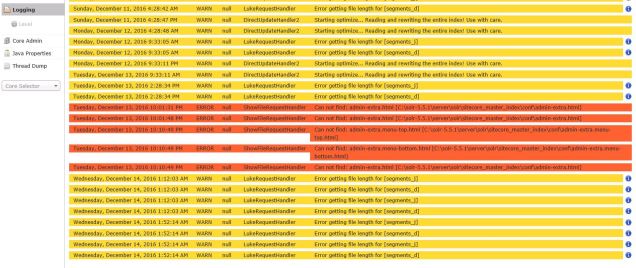
Besides these fairly routine entries in Solr logs, there will also be exceptions and sometimes using the Logging section of the Solr web admin provides a convenient way to see the most recent set of these exceptions. This is a convenient way of viewing Log4j items for your Solr implementation in near real-time; note if you make changes to the Level setting from this web interface, it is not persistent after a Solr restart.
Example of a Solr logging section in the web admin interface:
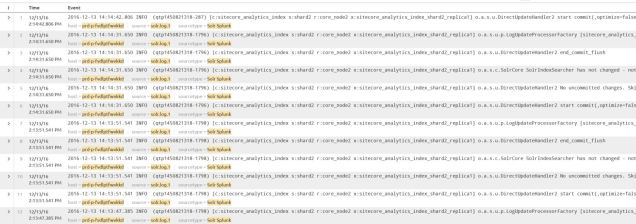
There are a number of other ways to review the Log4j data, old-school Chainsaw is still around, some I know some prefer Otros log viewer, but I’ve had success with Splunk (see screen shot below):
I’ll get into other methods for diagnostic work with Solr in the next post.
